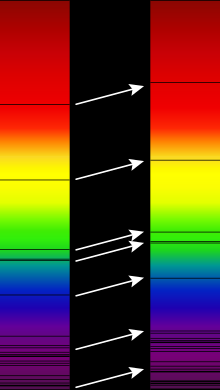
Absorption spectrum


An absorption or absorption line spectrum is a color or electromagnetic spectrum that contains dark spectral lines . It arises when broadband (white) light shines through matter and light quanta ( photons ) of certain wavelengths or wavelength ranges are absorbed ( resonance absorption ). The absorbed photons are missing in the light passing through, which is why the spectrum at the wavelengths concerned is dark or, in extreme cases, black.
These dark absorption lines are called Fraunhofer lines after their discoverer in the solar spectrum , but can also be detected in the spectrum of stars and many other celestial bodies .
description
If the photons are absorbed by exciting atoms, the amounts of energy and thus wavelengths are sharply defined, and the dark areas are correspondingly narrow lines. In molecules, however, many absorbable energy values are often close together and form broader dark areas in the spectrum, the absorption bands . In any case, the observed absorption spectrum is characteristic of the type of matter which the radiation traverses. That is why spectroscopy in different wavelength ranges, also with ultraviolet or infrared light, is an important method for the analysis of substances.
If free atoms (e.g. gas or steam ) are spectroscoped, the photons are re-emitted after absorption, namely uniformly in all spatial directions. If the light is only radiated in from one direction, the absorption spectrum typical for the type of atom ( chemical element ) is found as a line spectrum in the light that has passed through ; the light scattered in the other spatial directions shows the corresponding emission spectrum .
In the case of the spectroscopy of solids , a relaxation in the solid can occur between absorption and possible emission . Part of the photon energy is z. B. converted into heat. In this case, the absorption and emission spectra are not complementary to one another, as is the case with the free atoms.
For "forbidden lines" it is extremely unlikely that absorption can be observed.
application
Absorption spectra are also used in (environmental) measurement and analysis technology : with the help of an FTIR spectrometer , for example, the composition of a gas mixture (e.g. air ) can be examined quantitatively and qualitatively. The amount of this gas in the gas mixture measured can be determined using the absorption spectrum that is characteristic of each gas (“like a fingerprint”).
In atomic absorption spectrometry , the absorption spectrum of a sample is generated and measured. In this way the atomic composition of the sample can be determined.
Absorption spectra are of great importance in astronomy , as they can be used to determine the material composition and temperature of luminous celestial bodies (see the example of the solar spectrum on the right). Furthermore, magnetic fields can be determined using the Zeeman effect and rotations and radial speeds can be determined using the Doppler effect . The redshift of galaxies, which increases with distance , was the first indication of the expansion of space as early as the 1930s .
Web links
- Emission and absorption spectrum at school level ( LEIFI )
- Video: absorption and emission spectrum of sodium . Institute for Scientific Film (IWF) 2004, made available by the Technical Information Library (TIB), doi : 10.3203 / IWF / C-14885 .
