
Cape Neddick, Maine: Difference between revisions
→top: add "use mdy dates" template |
|||
| (3 intermediate revisions by 2 users not shown) | |||
| Line 1: | Line 1: | ||
{{For|more information about the CDP|York Beach, Maine}} |
{{For|more information about the CDP|York Beach, Maine}} |
||
{{Use mdy dates|date=July 2023}} |
|||
{{Infobox settlement |
{{Infobox settlement |
||
|official_name = Cape Neddick, Maine |
|official_name = Cape Neddick, Maine |
||
|settlement_type = [[Census-designated place]] |
|settlement_type = [[Census-designated place]] |
||
|nickname = |
|nickname = |
||
|motto = |
|motto = |
||
<!-- Images --> |
<!-- Images --> |
||
| Line 11: | Line 12: | ||
|image_caption = [[Cape Neddick Light]] c. 1920 |
|image_caption = [[Cape Neddick Light]] c. 1920 |
||
|image_flag = |
|image_flag = |
||
|image_seal = |
|image_seal = |
||
<!-- Maps --> |
<!-- Maps --> |
||
| Line 24: | Line 25: | ||
|image_map1 = |
|image_map1 = |
||
|mapsize1 = |
|mapsize1 = |
||
|map_caption1 = |
|map_caption1 = |
||
<!-- Location --> |
<!-- Location --> |
||
| Line 40: | Line 41: | ||
|leader_name1 = |
|leader_name1 = |
||
|established_title = |
|established_title = |
||
|established_date = |
|established_date = |
||
<!-- Area --> |
<!-- Area --> |
||
| Line 94: | Line 95: | ||
Extreme temperatures range from {{convert|−14|°F|0}} on February 15–16, 2003 up to {{convert|97|°F|°C}} on July 23, 2011; the record cold daily maximum is {{convert|0|°F|0}}, set on January 15, 2004, while, conversely, the record warm daily minimum is {{convert|77|°F|0}} on June 29, 2021.<ref name="Gray - Portland, ME"/> The coldest day of the year averaged {{convert|11|F|C}} in the 2001 to 2020 normals, while the warmest night average was at {{convert|70|F|C}}.<ref name="Gray - Portland, ME"/> The coldest has been February 2015 with a mean temperature of {{convert|12.2|F|1}}, while the warmest month was July 2010 at {{convert|72.3|F|1}}; the annual mean temperature has ranged from {{convert|45.8|F|1}} in 2014 to {{convert|49.0|F|1}} in 2010.<ref name="Gray - Portland, ME"/> Cape Neddick has about 2 days a year with afternoon temperatures above {{Convert|90|F}}, and 7 days a year with nighttime temperatures below {{Convert|0|F}}.<ref name="Gray - Portland, ME"/> |
Extreme temperatures range from {{convert|−14|°F|0}} on February 15–16, 2003 up to {{convert|97|°F|°C}} on July 23, 2011; the record cold daily maximum is {{convert|0|°F|0}}, set on January 15, 2004, while, conversely, the record warm daily minimum is {{convert|77|°F|0}} on June 29, 2021.<ref name="Gray - Portland, ME"/> The coldest day of the year averaged {{convert|11|F|C}} in the 2001 to 2020 normals, while the warmest night average was at {{convert|70|F|C}}.<ref name="Gray - Portland, ME"/> The coldest has been February 2015 with a mean temperature of {{convert|12.2|F|1}}, while the warmest month was July 2010 at {{convert|72.3|F|1}}; the annual mean temperature has ranged from {{convert|45.8|F|1}} in 2014 to {{convert|49.0|F|1}} in 2010.<ref name="Gray - Portland, ME"/> Cape Neddick has about 2 days a year with afternoon temperatures above {{Convert|90|F}}, and 7 days a year with nighttime temperatures below {{Convert|0|F}}.<ref name="Gray - Portland, ME"/> |
||
{{Weather box <!-- Infobox begins --> |
{{Weather box <!-- Infobox begins --> |
||
| |
|single line = Y |
||
| |
|location = Cape Neddick, Maine (1991–2020 normals, extremes 2000–present) |
||
<!-- High temperature extrema --> |
<!-- High temperature extrema --> |
||
|collapsed = Y |
|||
|Jan record high F = 64 |
|Jan record high F = 64 |
||
|Feb record high F = 66 |
|Feb record high F = 66 |
||
| Line 111: | Line 112: | ||
|Dec record high F = 70 |
|Dec record high F = 70 |
||
<!-- Mean maximum temperatures --> |
<!-- Mean maximum temperatures --> |
||
|Jan avg record high F = |
|Jan avg record high F = 50.1 |
||
|Feb avg record high F = 51. |
|Feb avg record high F = 51.7 |
||
|Mar avg record high F = |
|Mar avg record high F = 61.9 |
||
|Apr avg record high F = |
|Apr avg record high F = 71.7 |
||
|May avg record high F = |
|May avg record high F = 84.9 |
||
|Jun avg record high F = |
|Jun avg record high F = 87.6 |
||
|Jul avg record high F = 89. |
|Jul avg record high F = 89.9 |
||
|Aug avg record high F = |
|Aug avg record high F = 87.4 |
||
|Sep avg record high F = |
|Sep avg record high F = 83.7 |
||
|Oct avg record high F = |
|Oct avg record high F = 72.5 |
||
|Nov avg record high F = 65. |
|Nov avg record high F = 65.3 |
||
|Dec avg record high F = |
|Dec avg record high F = 54.9 |
||
|year avg record high F= 91. |
|year avg record high F = 91.7 |
||
<!-- Average high temperatures --> |
<!-- Average high temperatures --> |
||
| |
|Jan high F = 32.0 |
||
| |
|Feb high F = 34.9 |
||
| |
|Mar high F = 42.4 |
||
| |
|Apr high F = 55.6 |
||
| |
|May high F = 65.5 |
||
| |
|Jun high F = 73.6 |
||
| |
|Jul high F = 78.9 |
||
| |
|Aug high F = 78.7 |
||
| |
|Sep high F = 71.0 |
||
| |
|Oct high F = 59.4 |
||
| |
|Nov high F = 48.2 |
||
| |
|Dec high F = 37.9 |
||
|year high F = 56.5 |
|||
<!-- Mean daily temperature --> |
<!-- Mean daily temperature --> |
||
| |
|Jan mean F = 23.2 |
||
| |
|Feb mean F = 25.4 |
||
| |
|Mar mean F = 33.0 |
||
| |
|Apr mean F = 44.6 |
||
| |
|May mean F = 54.9 |
||
| |
|Jun mean F = 64.1 |
||
| |
|Jul mean F = 69.7 |
||
| |
|Aug mean F = 69.0 |
||
| |
|Sep mean F = 61.2 |
||
| |
|Oct mean F = 49.6 |
||
| |
|Nov mean F = 39.4 |
||
| |
|Dec mean F = 29.4 |
||
|year mean F = 47.0 |
|||
<!-- Average low temperatures --> |
<!-- Average low temperatures --> |
||
| |
|Jan low F = 14.4 |
||
| |
|Feb low F = 15.9 |
||
| |
|Mar low F = 23.5 |
||
| |
|Apr low F = 33.6 |
||
| |
|May low F = 44.2 |
||
| |
|Jun low F = 54.5 |
||
| |
|Jul low F = 60.5 |
||
| |
|Aug low F = 59.2 |
||
| |
|Sep low F = 51.4 |
||
| |
|Oct low F = 39.8 |
||
| |
|Nov low F = 30.5 |
||
| |
|Dec low F = 20.8 |
||
|year low F = 37.4 |
|||
<!-- Mean minimum temperatures --> |
<!-- Mean minimum temperatures --> |
||
|Jan avg record low F = - |
|Jan avg record low F = -3.9 |
||
|Feb avg record low F = - |
|Feb avg record low F = -0.8 |
||
|Mar avg record low F = 5. |
|Mar avg record low F = 5.2 |
||
|Apr avg record low F = 24. |
|Apr avg record low F = 24.3 |
||
|May avg record low F = 33.0 |
|May avg record low F = 33.0 |
||
|Jun avg record low F = 44. |
|Jun avg record low F = 44.2 |
||
|Jul avg record low F = 52.1 |
|Jul avg record low F = 52.1 |
||
|Aug avg record low F = |
|Aug avg record low F = 49.7 |
||
|Sep avg record low F = 38. |
|Sep avg record low F = 38.3 |
||
|Oct avg record low F = |
|Oct avg record low F = 29.2 |
||
|Nov avg record low F = 18. |
|Nov avg record low F = 18.1 |
||
|Dec avg record low F = |
|Dec avg record low F = 5.7 |
||
|year avg record low F= -6. |
|year avg record low F= -6.7 |
||
<!-- Low temperature extrema --> |
<!-- Low temperature extrema --> |
||
|Jan record low F = -13 |
|Jan record low F = -13 |
||
| Line 191: | Line 195: | ||
|Dec record low F = -11 |
|Dec record low F = -11 |
||
<!-- Total precipitation, this should include rain and snow. --> |
<!-- Total precipitation, this should include rain and snow. --> |
||
| |
|precipitation colour = green |
||
| |
|Jan precipitation inch = 3.61 |
||
| |
|Feb precipitation inch = 3.64 |
||
| |
|Mar precipitation inch = 4.92 |
||
| |
|Apr precipitation inch = 4.78 |
||
| |
|May precipitation inch = 3.93 |
||
| |
|Jun precipitation inch = 4.46 |
||
| |
|Jul precipitation inch = 3.80 |
||
| |
|Aug precipitation inch = 3.60 |
||
| |
|Sep precipitation inch = 4.30 |
||
| |
|Oct precipitation inch = 5.35 |
||
| |
|Nov precipitation inch = 4.30 |
||
| |
|Dec precipitation inch = 4.93 |
||
|year precipitation inch = 51.62 |
|||
<!-- Snowfall --> |
<!-- Snowfall --> |
||
| |
|Jan snow inch = 18.5 |
||
| |
|Feb snow inch = 20.1 |
||
| |
|Mar snow inch = 11.6 |
||
| |
|Apr snow inch = 2.4 |
||
| |
|May snow inch = 0.0 |
||
| |
|Jun snow inch = 0.0 |
||
| |
|Jul snow inch = 0.0 |
||
| |
|Aug snow inch = 0.0 |
||
| |
|Sep snow inch = 0.0 |
||
| |
|Oct snow inch = 0.0 |
||
| |
|Nov snow inch = 1.5 |
||
| |
|Dec snow inch = 16.0 |
||
|year snow inch = 70.1 |
|||
<!-- Precipitation days --> |
<!-- Precipitation days --> |
||
|unit precipitation days = 0.01 in |
|unit precipitation days = 0.01 in |
||
|unit snow days = 0.1 in |
|unit snow days = 0.1 in |
||
|Jan precipitation days = |
|Jan precipitation days = 10.6 |
||
|Feb precipitation days = 9 |
|Feb precipitation days = 9.2 |
||
|Mar precipitation days = 10 |
|Mar precipitation days = 10.3 |
||
|Apr precipitation days = 11 |
|Apr precipitation days = 11.4 |
||
|May precipitation days = 11 |
|May precipitation days = 11.3 |
||
|Jun precipitation days = 12 |
|Jun precipitation days = 12.0 |
||
|Jul precipitation days = |
|Jul precipitation days = 9.6 |
||
|Aug precipitation days = |
|Aug precipitation days = 8.7 |
||
|Sep precipitation days = |
|Sep precipitation days = 7.6 |
||
|Oct precipitation days = 10 |
|Oct precipitation days = 10.2 |
||
|Nov precipitation days = 10 |
|Nov precipitation days = 10.4 |
||
|Dec precipitation days = |
|Dec precipitation days = 11.9 |
||
|year precipitation days= |
|year precipitation days= 123.2 |
||
<!-- Snow days --> |
<!-- Snow days --> |
||
|Jan snow days = 7 |
|Jan snow days = 7.4 |
||
|Feb snow days = 6 |
|Feb snow days = 6.3 |
||
|Mar snow days = |
|Mar snow days = 3.9 |
||
|Apr snow days = 1 |
|Apr snow days = 1.4 |
||
|May snow days = 0 |
|May snow days = 0.0 |
||
|Jun snow days = 0 |
|Jun snow days = 0.0 |
||
|Jul snow days = 0 |
|Jul snow days = 0.0 |
||
|Aug snow days = 0 |
|Aug snow days = 0.0 |
||
|Sep snow days = 0 |
|Sep snow days = 0.0 |
||
|Oct snow days = 0 |
|Oct snow days = 0.1 |
||
|Nov snow days = 1 |
|Nov snow days = 1.1 |
||
|Dec snow days = |
|Dec snow days = 5.8 |
||
|year snow days= 26 |
|year snow days= 26.0 |
||
|Jan snow depth inch = 12 |
|Jan snow depth inch = 12.3 |
||
|Feb snow depth inch = 17 |
|Feb snow depth inch = 17.9 |
||
|Mar snow depth inch = |
|Mar snow depth inch = 15.3 |
||
|Apr snow depth inch = 5 |
|Apr snow depth inch = 5.1 |
||
|May snow depth inch = 0 |
|May snow depth inch = 0.0 |
||
|Jun snow depth inch = 0 |
|Jun snow depth inch = 0.0 |
||
|Jul snow depth inch = 0 |
|Jul snow depth inch = 0.0 |
||
|Aug snow depth inch = 0 |
|Aug snow depth inch = 0.0 |
||
|Sep snow depth inch = 0 |
|Sep snow depth inch = 0.0 |
||
|Oct snow depth inch = 0 |
|Oct snow depth inch = 0.4 |
||
|Nov snow depth inch = |
|Nov snow depth inch = 1.4 |
||
|Dec snow depth inch = |
|Dec snow depth inch = 9.5 |
||
|year snow depth inch= 21 |
|year snow depth inch= 21.1 |
||
<!-- Mandatory fields, source --> |
<!-- Mandatory fields, source --> |
||
|source 1 = [[NOAA]] (mean maxima/minima, snow depth 2006–2020)<ref>{{cite web |
|||
| |
|url = https://www.ncei.noaa.gov/access/us-climate-normals/#dataset=normals-monthly&timeframe=30&station=USC00171131 |
||
|title = NOAA NCEI U.S. Climate Normals Quick Access |
|||
|publisher = NOAA |
|||
|access-date = 2022-12-26 }}</ref><ref name="Gray - Portland, ME">{{cite web |
|||
|url=https://www.weather.gov/wrh/Climate?wfo=gyx |
|||
|title=NOWData - NOAA Online Weather Data |
|||
|publisher=[[National Oceanic and Atmospheric Administration]] |
|||
|access-date = June 14, 2023}}</ref><ref> |
|||
{{cite web |
|||
|url = https://www.ncei.noaa.gov/access/services/data/v1?dataset=normals-monthly-1991-2020&stations=USC00171131&format=pdf&dataTypes=MLY-TMAX-NORMAL,MLY-TMIN-NORMAL,MLY-TAVG-NORMAL,MLY-PRCP-NORMAL,MLY-SNOW-NORMAL |
|||
|publisher = National Oceanic and Atmospheric Administration |
|||
|title = U.S. Climate Normals Quick Access – Station: CAPE NEDDICK, ME US USC00171131 |
|||
|access-date = June 14, 2023 |
|||
|archive-url = https://web.archive.org/web/20230614062336/https://www.ncei.noaa.gov/access/services/data/v1?dataset=normals-monthly-1991-2020&stations=USC00171131&format=pdf&dataTypes=MLY-TMAX-NORMAL,MLY-TMIN-NORMAL,MLY-TAVG-NORMAL,MLY-PRCP-NORMAL,MLY-SNOW-NORMAL |
|||
|archive-date = 2023-06-14 |
|||
}} |
|||
</ref> |
|||
}}<!-- Infobox ends --> |
}}<!-- Infobox ends --> |
||
Latest revision as of 21:54, 7 July 2023
Cape Neddick, Maine | |
|---|---|
 Cape Neddick Light c. 1920 | |
 Cape Neddick Location within the state of Maine | |
| Coordinates: 43°10′8″N 70°37′2″W / 43.16889°N 70.61722°W | |
| Country | United States |
| State | Maine |
| County | York |
| Area | |
| • Total | 3.96 sq mi (10.27 km2) |
| • Land | 3.73 sq mi (9.66 km2) |
| • Water | 0.23 sq mi (0.61 km2) |
| Elevation | 39 ft (12 m) |
| Population (2020) | |
| • Total | 3,037 |
| • Density | 813.99/sq mi (314.28/km2) |
| Time zone | UTC-5 (Eastern (EST)) |
| • Summer (DST) | UTC-4 (EDT) |
| ZIP code | 03902 |
| Area code | 207 |
| FIPS code | 23-10320 |
| GNIS feature ID | 0563478 |
Cape Neddick is a census-designated place (CDP) in the town of York in York County, Maine, United States. The population was 2,568 at the 2010 census.[2] It is part of the Portland–South Portland–Biddeford, Maine Metropolitan Statistical Area.
Geography[edit]
Cape Neddick is located at 43°10′8″N 70°37′2″W / 43.16889°N 70.61722°W (43.169023, -70.617341).[3] The CDP as defined includes all of the physical peninsula known as Cape Neddick, plus all of the unincorporated community of York Beach, which consists of two beaches, one on either side of Cape Neddick. The northern limit of the CDP is Cape Neddick Harbor, the western limit is Route 1, and the southern boundary is the border with York Harbor. According to the United States Census Bureau, the CDP has a total area of 4.0 square miles (10 km2), of which 3.7 square miles (9.6 km2) is land and 0.2 square miles (0.52 km2) of it, or 6.03%, is water.[2]
Cape Neddick Light, also known as Nubble Lighthouse, is the most distinctive feature of the community. Construction began in 1876 and cost $15,000. It was first illuminated on July 1, 1879. The lighthouse was originally red but has been painted white since 1902. The distinctive red house was also built in 1902. The tower stands 41 feet (12 m) tall. The lighthouse became automated in 1987.[4]
Climate[edit]
Cape Neddick has a humid continental climate (Köppen Dfb), its main features are long cold winters and sometimes hot summers. Affected by the Gulf of Maine, winters are not so severe compared to other parts of Maine. Since the weather station was established and began to observe in 2000, it has never measured a low temperature below −20 °F (−29 °C).[5] Cape Neddick's annual average temperature is 47.0 °F (8.3 °C), the coldest month is 23.2 °F (−4.9 °C) in January, and the hottest month is 69.7 °F (20.9 °C) in July.
Extreme temperatures range from −14 °F (−26 °C) on February 15–16, 2003 up to 97 °F (36 °C) on July 23, 2011; the record cold daily maximum is 0 °F (−18 °C), set on January 15, 2004, while, conversely, the record warm daily minimum is 77 °F (25 °C) on June 29, 2021.[5] The coldest day of the year averaged 11 °F (−12 °C) in the 2001 to 2020 normals, while the warmest night average was at 70 °F (21 °C).[5] The coldest has been February 2015 with a mean temperature of 12.2 °F (−11.0 °C), while the warmest month was July 2010 at 72.3 °F (22.4 °C); the annual mean temperature has ranged from 45.8 °F (7.7 °C) in 2014 to 49.0 °F (9.4 °C) in 2010.[5] Cape Neddick has about 2 days a year with afternoon temperatures above 90 °F (32 °C), and 7 days a year with nighttime temperatures below 0 °F (−18 °C).[5]
| Climate data for Cape Neddick, Maine (1991–2020 normals, extremes 2000–present) | |||||||||||||
|---|---|---|---|---|---|---|---|---|---|---|---|---|---|
| Month | Jan | Feb | Mar | Apr | May | Jun | Jul | Aug | Sep | Oct | Nov | Dec | Year |
| Record high °F (°C) | 64 (18) |
66 (19) |
84 (29) |
94 (34) |
95 (35) |
94 (34) |
97 (36) |
95 (35) |
94 (34) |
80 (27) |
77 (25) |
70 (21) |
97 (36) |
| Mean maximum °F (°C) | 50.1 (10.1) |
51.7 (10.9) |
61.9 (16.6) |
71.7 (22.1) |
84.9 (29.4) |
87.6 (30.9) |
89.9 (32.2) |
87.4 (30.8) |
83.7 (28.7) |
72.5 (22.5) |
65.3 (18.5) |
54.9 (12.7) |
91.7 (33.2) |
| Mean daily maximum °F (°C) | 32.0 (0.0) |
34.9 (1.6) |
42.4 (5.8) |
55.6 (13.1) |
65.5 (18.6) |
73.6 (23.1) |
78.9 (26.1) |
78.7 (25.9) |
71.0 (21.7) |
59.4 (15.2) |
48.2 (9.0) |
37.9 (3.3) |
56.5 (13.6) |
| Daily mean °F (°C) | 23.2 (−4.9) |
25.4 (−3.7) |
33.0 (0.6) |
44.6 (7.0) |
54.9 (12.7) |
64.1 (17.8) |
69.7 (20.9) |
69.0 (20.6) |
61.2 (16.2) |
49.6 (9.8) |
39.4 (4.1) |
29.4 (−1.4) |
47.0 (8.3) |
| Mean daily minimum °F (°C) | 14.4 (−9.8) |
15.9 (−8.9) |
23.5 (−4.7) |
33.6 (0.9) |
44.2 (6.8) |
54.5 (12.5) |
60.5 (15.8) |
59.2 (15.1) |
51.4 (10.8) |
39.8 (4.3) |
30.5 (−0.8) |
20.8 (−6.2) |
37.4 (3.0) |
| Mean minimum °F (°C) | −3.9 (−19.9) |
−0.8 (−18.2) |
5.2 (−14.9) |
24.3 (−4.3) |
33.0 (0.6) |
44.2 (6.8) |
52.1 (11.2) |
49.7 (9.8) |
38.3 (3.5) |
29.2 (−1.6) |
18.1 (−7.7) |
5.7 (−14.6) |
−6.7 (−21.5) |
| Record low °F (°C) | −13 (−25) |
−14 (−26) |
−4 (−20) |
15 (−9) |
29 (−2) |
38 (3) |
45 (7) |
44 (7) |
33 (1) |
21 (−6) |
5 (−15) |
−11 (−24) |
−14 (−26) |
| Average precipitation inches (mm) | 3.61 (92) |
3.64 (92) |
4.92 (125) |
4.78 (121) |
3.93 (100) |
4.46 (113) |
3.80 (97) |
3.60 (91) |
4.30 (109) |
5.35 (136) |
4.30 (109) |
4.93 (125) |
51.62 (1,311) |
| Average snowfall inches (cm) | 18.5 (47) |
20.1 (51) |
11.6 (29) |
2.4 (6.1) |
0.0 (0.0) |
0.0 (0.0) |
0.0 (0.0) |
0.0 (0.0) |
0.0 (0.0) |
0.0 (0.0) |
1.5 (3.8) |
16.0 (41) |
70.1 (178) |
| Average extreme snow depth inches (cm) | 12.3 (31) |
17.9 (45) |
15.3 (39) |
5.1 (13) |
0.0 (0.0) |
0.0 (0.0) |
0.0 (0.0) |
0.0 (0.0) |
0.0 (0.0) |
0.4 (1.0) |
1.4 (3.6) |
9.5 (24) |
21.1 (54) |
| Average precipitation days (≥ 0.01 in) | 10.6 | 9.2 | 10.3 | 11.4 | 11.3 | 12.0 | 9.6 | 8.7 | 7.6 | 10.2 | 10.4 | 11.9 | 123.2 |
| Average snowy days (≥ 0.1 in) | 7.4 | 6.3 | 3.9 | 1.4 | 0.0 | 0.0 | 0.0 | 0.0 | 0.0 | 0.1 | 1.1 | 5.8 | 26.0 |
| Source: NOAA (mean maxima/minima, snow depth 2006–2020)[6][5][7] | |||||||||||||
Demographics[edit]
| Census | Pop. | Note | %± |
|---|---|---|---|
| 2020 | 3,037 | — | |
| U.S. Decennial Census[8] | |||
As of the census[9] of 2000, there were 2,997 people, 1,340 households, and 897 families residing in the CDP. The population density was 801.5 inhabitants per square mile (309.5/km2). There were 3,424 housing units at an average density of 915.7 per square mile (353.6/km2). The racial makeup of the CDP was 98.26% White, 0.27% African American, 0.47% Asian, 0.10% Pacific Islander, 0.20% from other races, and 0.70% from two or more races. Hispanic or Latino of any race were 0.90% of the population.
There were 1,340 households, out of which 22.3% had children under the age of 18 living with them, 55.7% were married couples living together, 8.2% had a female householder with no husband present, and 33.0% were non-families. 27.2% of all households were made up of individuals, and 11.2% had someone living alone who was 65 years of age or older. The average household size was 2.24 and the average family size was 2.70.
In the CDP, the population was spread out, with 18.2% under the age of 18, 4.4% from 18 to 24, 23.9% from 25 to 44, 33.9% from 45 to 64, and 19.6% who were 65 years of age or older. The median age was 47 years. For every 100 females, there were 88.4 males. For every 100 females age 18 and over, there were 86.7 males.
The median income for a household in the CDP was $45,500, and the median income for a family was $52,796. Males had a median income of $42,386 versus $30,800 for females. The per capita income for the CDP was $33,788. About 2.2% of families and 5.6% of the population were below the poverty line, including 4.6% of those under age 18 and 5.2% of those age 65 or over.
Points of interest[edit]
There are two listings on the National Register of Historic Places for Cape Neddick. One is St. Peter's By-The-Sea Protestant Episcopal Church, and the other is Cape Neddick Light just off the coast.
Activities[edit]
Cape Neddick Country Club offers golfing on an 18-hole course designed by Donald Ross
History[edit]
Before 1655 Cape Neddick was inhabited by John Gooch, Peter Weare, Edward Wanton, Sylvester Stover and Thomas Wheelwright and their families.[10]
Notable residents[edit]
- Phyllis Brooks, actress
- Peter Clines, writer
- Dawn Hill, state legislator
- Paul D. McGowan, state legislator
References[edit]
- ^ "2020 U.S. Gazetteer Files". United States Census Bureau. Retrieved April 8, 2022.
- ^ a b "Geographic Identifiers: 2010 Demographic Profile Data (G001): Neddick CDP, Maine". U.S. Census Bureau, American Factfinder. Archived from the original on February 12, 2020. Retrieved January 29, 2013.
- ^ "US Gazetteer files: 2010, 2000, and 1990". United States Census Bureau. February 12, 2011. Retrieved April 23, 2011.
- ^ Jeremy D'Entremont (2011). "Cape Neddick ("Nubble") Light".
- ^ a b c d e f "NOWData - NOAA Online Weather Data". National Oceanic and Atmospheric Administration. Retrieved June 14, 2023.
- ^ "NOAA NCEI U.S. Climate Normals Quick Access". NOAA. Retrieved December 26, 2022.
- ^ "U.S. Climate Normals Quick Access – Station: CAPE NEDDICK, ME US USC00171131". National Oceanic and Atmospheric Administration. Archived from the original on June 14, 2023. Retrieved June 14, 2023.
- ^ "Census of Population and Housing". Census.gov. Retrieved June 4, 2016.
- ^ "U.S. Census website". United States Census Bureau. Retrieved January 31, 2008.
- ^ "Findings from the York/Cape Neddick Archaeological Survey 1996", by Kathleen Wheeler, Ph.D.
External links[edit]
Municipalities and communities of York County, Maine, United States | ||
|---|---|---|
| Cities | 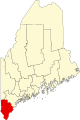 | |
| Towns | ||
| CDPs | ||
| Unincorporated communities and villages | ||
| Footnotes | ‡This populated place also has portions in an adjacent county | |