Buttonwillow, California: Difference between revisions
Modified historical population, infobox (via CenPop script) |
Added missing 2000 and 2010 variables to the census table |
||
| (12 intermediate revisions by 11 users not shown) | |||
| Line 1: | Line 1: | ||
{{ |
{{Use mdy dates|date=July 2023}} |
||
{{POV|date=May 2020}} |
|||
{{Infobox settlement |
{{Infobox settlement |
||
|official_name = Buttonwillow |
|official_name = Buttonwillow |
||
| Line 42: | Line 43: | ||
| area_water_km2 = 0.00 |
| area_water_km2 = 0.00 |
||
| area_water_percent = 0 |
| area_water_percent = 0 |
||
| area_note = |
| area_note = |
||
|elevation_ft = 269 |
|elevation_ft = 269 |
||
| Line 79: | Line 80: | ||
The town was originally called '''Buena Vista''' when it was founded in 1895, but the name quickly became Buttonwillow.<ref name=CGN /> |
The town was originally called '''Buena Vista''' when it was founded in 1895, but the name quickly became Buttonwillow.<ref name=CGN /> |
||
Buttonwillow was named for the ''buttonbush'' ''([[Cephalanthus occidentalis]])''. A lone buttonbush served as a landmark on an old trans-valley trail and was used by ancient [[ |
Buttonwillow was named for the ''buttonbush'' ''([[Cephalanthus occidentalis]])''. A lone buttonbush served as a landmark on an old trans-valley trail and was used by ancient [[Yokuts]] Indian as a meeting place, later becoming the site of settlers' stock rodeos. The [[Miller & Lux]] holdings company eventually established a headquarters and store near the tree.<ref>David W. Kean, ''Wide Places in the California Roads: The encyclopedia of California's small towns and the roads that lead to them (Volume 1 of 4: Southern California Counties)'', p. 19</ref> This tree is listed as [[California Historical Landmark]] No. 492. This landmark is now known as the Buttonwillow Tree. |
||
California Historical Landmark reads: |
California Historical Landmark reads: |
||
:.NO. 492 BUTTONWILLOW TREE - This lone tree, which gave the town of Buttonwillow its name, served as a landmark on an old trans-valley trail. An ancient Yokuts Indian meeting place, it later became the site of settlers' stock rodeos. Miller and Lux established their headquarters and store here about 1885. |
:.NO. 492 BUTTONWILLOW TREE - This lone tree, which gave the town of Buttonwillow its name, served as a landmark on an old trans-valley trail. An ancient Yokuts Indian meeting place, it later became the site of settlers' stock rodeos. Miller and Lux established their headquarters and store here about 1885."<ref>[https://www.californiahistoricallandmarks.com/landmarks/chl-492 californiahistoricallandmarks.com Landmark chl-492]</ref> |
||
The first United States Post Office at Buttonwillow was established in 1895.<ref name=CGN /> |
The first United States Post Office at Buttonwillow was established in 1895.<ref name=CGN /> |
||
| Line 87: | Line 88: | ||
==Facilities== |
==Facilities== |
||
[[File:Buttonwillow, California, public library, 2011.jpg|thumb|right|Buttonwillow Public Library]] |
[[File:Buttonwillow, California, public library, 2011.jpg|thumb|right|Buttonwillow Public Library]] |
||
Buttonwillow is a major stop for motorists traveling on [[Interstate 5 (California)|Interstate 5]]. It includes gas stations |
Buttonwillow is a major stop for motorists traveling on [[Interstate 5 (California)|Interstate 5]]. It includes gas stations, restaurants and travel centers. These are all at the exit of [[California State Route 58|State Route 58]]. |
||
There is a large [[electrical substation]] next to the town that is a part of a major north–south transmission corridor. It marks the northern end of [[Path 26]] across the [[Transverse Ranges]] and the southern end of the [[Path 15]] [[electric power transmission|power line]]s. Buttonwillow is the motel hub for members of the [[Sports Car Club of America]]'s Cal Club region when they hold events at Cal Club-owned [[Buttonwillow Raceway Park]] |
There is a large [[electrical substation]] next to the town that is a part of a major north–south transmission corridor. It marks the northern end of [[Path 26]] across the [[Transverse Ranges]] and the southern end of the [[Path 15]] [[electric power transmission|power line]]s. Buttonwillow is the motel hub for members of the [[Sports Car Club of America]]'s Cal Club region when they hold events at Cal Club-owned [[Buttonwillow Raceway Park]]. Several motels are located there as well. |
||
The town is also known for hosting the Best in the West jet rally, an annual gathering of model jet enthusiasts.<ref> |
The town is also known for hosting the Best in the West jet rally, an annual gathering of model jet enthusiasts.<ref>{{Cite web|url=https://www.rcflightdeck.com/event.cfm?event_id=8287|title=30th. Annual 2019 Best in the West Jet Rally}}</ref> |
||
Buttonwillow's main industry is cotton farming.<ref>David W. Kean, ''Wide Places in the California Roads: The encyclopedia of California's small towns and the roads that lead to them'' (Volume 1 of 4: Southern California Counties), p. 29</ref> |
Buttonwillow's main industry is cotton farming.<ref>David W. Kean, ''Wide Places in the California Roads: The encyclopedia of California's small towns and the roads that lead to them'' (Volume 1 of 4: Southern California Counties), p. 29</ref> |
||
| Line 103: | Line 104: | ||
Buttonwillow has a [[cold desert climate]] ([[Köppen climate classification|BWk]]) typical of the southern part of [[Central Valley (California)|California's Central Valley]] with hot, dry summers and cool winters. |
Buttonwillow has a [[cold desert climate]] ([[Köppen climate classification|BWk]]) typical of the southern part of [[Central Valley (California)|California's Central Valley]] with hot, dry summers and cool winters. |
||
{{Weather box |
{{Weather box |
||
|location = Buttonwillow, California ( |
|location = Buttonwillow, California (1991–2020 normals, extremes 1940–present) |
||
|single line = Y |
|single line = Y |
||
|width = auto |
|||
|Jan record high F = 80 |
|Jan record high F = 80 |
||
|Feb record high F = 85 |
|Feb record high F = 85 |
||
| Line 118: | Line 120: | ||
|Dec record high F = 81 |
|Dec record high F = 81 |
||
|year record high F = 114 |
|year record high F = 114 |
||
|Jan avg record high F = |
|Jan avg record high F = 69.9 |
||
|Feb avg record high F = 76 |
|Feb avg record high F = 76.0 |
||
|Mar avg record high F = |
|Mar avg record high F = 83.1 |
||
|Apr avg record high F = |
|Apr avg record high F = 91.6 |
||
|May avg record high F = |
|May avg record high F = 98.8 |
||
|Jun avg record high F = 104 |
|Jun avg record high F = 104.3 |
||
|Jul avg record high F = 105 |
|Jul avg record high F = 105.7 |
||
|Aug avg record high F = 105 |
|Aug avg record high F = 105.3 |
||
|Sep avg record high F = 102 |
|Sep avg record high F = 102.3 |
||
|Oct avg record high F = |
|Oct avg record high F = 94.0 |
||
|Nov avg record high F = 80 |
|Nov avg record high F = 80.9 |
||
|Dec avg record high F = 70 |
|Dec avg record high F = 70.5 |
||
|year avg record high F = |
|year avg record high F = 107.8 |
||
|Jan high F = |
|Jan high F = 57.6 |
||
|Feb high F = |
|Feb high F = 64.0 |
||
|Mar high F = 69. |
|Mar high F = 69.8 |
||
|Apr high F = |
|Apr high F = 76.0 |
||
|May high F = 84. |
|May high F = 84.3 |
||
|Jun high F = |
|Jun high F = 92.4 |
||
|Jul high F = |
|Jul high F = 97.8 |
||
|Aug high F = |
|Aug high F = 96.6 |
||
|Sep high F = |
|Sep high F = 91.4 |
||
|Oct high F = 80. |
|Oct high F = 80.8 |
||
|Nov high F = |
|Nov high F = 67.3 |
||
|Dec high F = |
|Dec high F = 58.2 |
||
|year high F = |
|year high F = 78.0 |
||
|Jan mean F = |
|Jan mean F = 47.5 |
||
|Feb mean F = |
|Feb mean F = 52.4 |
||
|Mar mean F = 57. |
|Mar mean F = 57.5 |
||
|Apr mean F = 62. |
|Apr mean F = 62.5 |
||
|May mean F = 70. |
|May mean F = 70.2 |
||
|Jun mean F = |
|Jun mean F = 77.3 |
||
|Jul mean F = |
|Jul mean F = 82.7 |
||
|Aug mean F = |
|Aug mean F = 81.2 |
||
|Sep mean F = |
|Sep mean F = 75.8 |
||
|Oct mean F = 65. |
|Oct mean F = 65.6 |
||
|Nov mean F = |
|Nov mean F = 54.1 |
||
|Dec mean F = |
|Dec mean F = 46.9 |
||
|year mean F = |
|year mean F = 64.5 |
||
|Jan low F = |
|Jan low F = 37.5 |
||
|Feb low F = 40. |
|Feb low F = 40.9 |
||
|Mar low F = 45. |
|Mar low F = 45.3 |
||
|Apr low F = |
|Apr low F = 49.0 |
||
|May low F = |
|May low F = 56.1 |
||
|Jun low F = |
|Jun low F = 62.3 |
||
|Jul low F = |
|Jul low F = 67.7 |
||
|Aug low F = |
|Aug low F = 65.8 |
||
|Sep low F = |
|Sep low F = 60.1 |
||
|Oct low F = |
|Oct low F = 50.5 |
||
|Nov low F = 40. |
|Nov low F = 40.8 |
||
|Dec low F = 35. |
|Dec low F = 35.6 |
||
|year low F = |
|year low F = 51.0 |
||
|Jan avg record low F = 27 |
|Jan avg record low F = 27.9 |
||
|Feb avg record low F = 31 |
|Feb avg record low F = 31.0 |
||
|Mar avg record low F = 35 |
|Mar avg record low F = 35.4 |
||
|Apr avg record low F = |
|Apr avg record low F = 38.8 |
||
|May avg record low F = |
|May avg record low F = 46.4 |
||
|Jun avg record low F = 52 |
|Jun avg record low F = 52.2 |
||
|Jul avg record low F = 59 |
|Jul avg record low F = 59.2 |
||
|Aug avg record low F = |
|Aug avg record low F = 57.4 |
||
|Sep avg record low F = 50 |
|Sep avg record low F = 50.7 |
||
|Oct avg record low F = |
|Oct avg record low F = 39.8 |
||
|Nov avg record low F = |
|Nov avg record low F = 30.1 |
||
|Dec avg record low F = 25 |
|Dec avg record low F = 25.9 |
||
|year avg record low F = 24 |
|year avg record low F = 24.5 |
||
|Jan record low F = 9 |
|Jan record low F = 9 |
||
|Feb record low F = 19 |
|Feb record low F = 19 |
||
| Line 197: | Line 199: | ||
|year record low F = 9 |
|year record low F = 9 |
||
|precipitation colour = green |
|precipitation colour = green |
||
|Jan precipitation inch = 1. |
|Jan precipitation inch = 1.19 |
||
|Feb precipitation inch = 1. |
|Feb precipitation inch = 1.06 |
||
|Mar precipitation inch = 1. |
|Mar precipitation inch = 1.15 |
||
|Apr precipitation inch = 0. |
|Apr precipitation inch = 0.47 |
||
|May precipitation inch = 0. |
|May precipitation inch = 0.27 |
||
|Jun precipitation inch = 0. |
|Jun precipitation inch = 0.04 |
||
|Jul precipitation inch = 0. |
|Jul precipitation inch = 0.07 |
||
|Aug precipitation inch = 0. |
|Aug precipitation inch = 0.00 |
||
|Sep precipitation inch = 0. |
|Sep precipitation inch = 0.03 |
||
|Oct precipitation inch = 0. |
|Oct precipitation inch = 0.26 |
||
|Nov precipitation inch = 0. |
|Nov precipitation inch = 0.46 |
||
|Dec precipitation inch = |
|Dec precipitation inch = 1.01 |
||
|year precipitation inch = 6. |
|year precipitation inch = 6.01 |
||
|Jan precipitation days = |
|Jan precipitation days = 6.3 |
||
|Feb precipitation days = 6. |
|Feb precipitation days = 6.0 |
||
|Mar precipitation days = |
|Mar precipitation days = 5.4 |
||
|Apr precipitation days = |
|Apr precipitation days = 2.8 |
||
|May precipitation days = 1.6 |
|May precipitation days = 1.6 |
||
|Jun precipitation days = 0. |
|Jun precipitation days = 0.2 |
||
|Jul precipitation days = 0.2 |
|Jul precipitation days = 0.2 |
||
|Aug precipitation days = 0. |
|Aug precipitation days = 0.1 |
||
|Sep precipitation days = 0. |
|Sep precipitation days = 0.3 |
||
|Oct precipitation days = |
|Oct precipitation days = 1.5 |
||
|Nov precipitation days = |
|Nov precipitation days = 2.7 |
||
|Dec precipitation days = 5. |
|Dec precipitation days = 5.0 |
||
|year precipitation days = |
|year precipitation days = |
||
|source 1 = [[NOAA]]<ref name=NOAA>{{cite web|url=https://w2.weather.gov/climate/xmacis.php?wfo=hnx|title=Buttonwillow |
|source 1 = [[NOAA]]<ref name=NOAA>{{cite web|url=https://w2.weather.gov/climate/xmacis.php?wfo=hnx|title=Buttonwillow – NWS Hanford CA NOAA Online Weather Data|access-date=February 10, 2021}}</ref><ref> |
||
{{cite web |
|||
|url = https://www.ncei.noaa.gov/access/services/data/v1?dataset=normals-monthly-1991-2020&stations=USC00041244&format=pdf&dataTypes=MLY-TMAX-NORMAL,MLY-TMIN-NORMAL,MLY-TAVG-NORMAL,MLY-PRCP-NORMAL,MLY-SNOW-NORMAL |
|||
|publisher = National Oceanic and Atmospheric Administration |
|||
|title = U.S. Climate Normals Quick Access – Station: Buttonwillow, CA |
|||
|access-date = May 26, 2023 |
|||
}} |
|||
</ref> |
|||
}} |
}} |
||
==Demographics== |
==Demographics== |
||
{{US Census population |
{{US Census population |
||
|2000= 1266 |
|||
|2010= 1508 |
|||
|2020= 1337 |
|2020= 1337 |
||
|footnote=U.S. Decennial Census<ref name="DecennialCensus">{{cite web|url=https://www.census.gov/programs-surveys/decennial-census.html|title=Census of Population and Housing|publisher=Census.gov|access-date=June 4, 2016}}</ref> |
|footnote=U.S. Decennial Census<ref name="DecennialCensus">{{cite web|url=https://www.census.gov/programs-surveys/decennial-census.html|title=Census of Population and Housing|publisher=Census.gov|access-date=June 4, 2016}}</ref> |
||
| Line 233: | Line 244: | ||
===2010=== |
===2010=== |
||
At the [[2010 United States Census|2010 census]] Buttonwillow had a population of 1,508. The population density was 217.7 |
At the [[2010 United States Census|2010 census]] Buttonwillow had a population of 1,508. The population density was {{convert|217.7|PD/sqmi|PD/km2|sp=us|adj=off}}. The racial makeup of Buttonwillow was 534 (35.4%) White, 36 (2.4%) African American, 11 (0.7%) Native American, 10 (0.7%) Asian, 0 (0.0%) Pacific Islander, 890 (59.0%) from other races, and 27 (1.8%) from two or more races. Hispanic or Latino of any race were 1,183 persons (78.4%).<ref>{{cite web|url=http://www.census.gov/2010census/popmap/ipmtext.php?fl=06:0609332|archive-url=https://archive.today/20140715023821/http://www.census.gov/2010census/popmap/ipmtext.php?fl=06:0609332|url-status=dead|archive-date=July 15, 2014|title=2010 Census Interactive Population Search: CA - Buttonwillow CDP|publisher=U.S. Census Bureau|access-date=July 12, 2014}}</ref> |
||
The whole population lived in households, no one lived in non-institutionalized group quarters and no one was institutionalized. |
The whole population lived in households, no one lived in non-institutionalized group quarters and no one was institutionalized. |
||
| Line 244: | Line 255: | ||
===2000=== |
===2000=== |
||
At the [[2000 United States Census|2000 census]] there were 1,266 people, 328 households, and 270 families in the CDP. The population density was 181.7 |
At the [[2000 United States Census|2000 census]] there were 1,266 people, 328 households, and 270 families in the CDP. The population density was {{convert|181.7|PD/sqmi|PD/km2|sp=us|adj=off}}. There were 364 housing units at an average density of {{convert|52.2|/sqmi|/km2|sp=us|adj=off}}. The [[Race and ethnicity in the United States Census#2000 census|racial makeup]] of the CDP was 34.28% White, 3.79% Black or African American, 1.66% Native American, 0.08% Asian, 55.06% from other races, and 5.13% from two or more races. 68.40% of the population were Hispanic or Latino of any race.<ref name="GR2">{{cite web |url=https://www.census.gov |publisher=[[United States Census Bureau]] |access-date=2008-01-31 |title=U.S. Census website }}</ref> |
||
Of the 328 households 56.4% had children under the age of 18 living with them, 61.6% were married couples living together, 14.3% had a female householder with no husband present, and 17.4% were non-families. 15.2% of households were one person and 7.9% were one person aged 65 or older. The average household size was 3.81 and the average family size was 4.25. |
Of the 328 households 56.4% had children under the age of 18 living with them, 61.6% were married couples living together, 14.3% had a female householder with no husband present, and 17.4% were non-families. 15.2% of households were one person and 7.9% were one person aged 65 or older. The average household size was 3.81 and the average family size was 4.25. |
||
| Line 289: | Line 300: | ||
A major divider in the struggle of Buttonwillow against Laidlaw Environmental was the issue of race. While the LAC could have spent time gathering community support and increasing awareness about the toxins, the committee members were instead battling racial discrimination and a debate with the county about Spanish translation. A local community group, known as Padres Hacia una Vida Mejor, worked for these particular rights.<ref>Tan, Elizabeth. 1995. "The Grassroots Struggle for Environmental Justice: The Need for a New Approach to Public Health in Kern County, California".</ref> Furthermore, the translation issue seemed to create a division among the county's residents. For example, in their efforts to institute Spanish translation of the EIR and public hearings, the Latino residents isolated themselves from the black and white people in the community. Many English-speaking residents did not support the translation and felt that speaking English was key if Latinos “wanted to live in [their] country”.<ref name="Cole and Foster 2001"/> Because of these divisions, a racial streak emerged in the community, further dividing the community and decreasing the strength of their resistance. |
A major divider in the struggle of Buttonwillow against Laidlaw Environmental was the issue of race. While the LAC could have spent time gathering community support and increasing awareness about the toxins, the committee members were instead battling racial discrimination and a debate with the county about Spanish translation. A local community group, known as Padres Hacia una Vida Mejor, worked for these particular rights.<ref>Tan, Elizabeth. 1995. "The Grassroots Struggle for Environmental Justice: The Need for a New Approach to Public Health in Kern County, California".</ref> Furthermore, the translation issue seemed to create a division among the county's residents. For example, in their efforts to institute Spanish translation of the EIR and public hearings, the Latino residents isolated themselves from the black and white people in the community. Many English-speaking residents did not support the translation and felt that speaking English was key if Latinos “wanted to live in [their] country”.<ref name="Cole and Foster 2001"/> Because of these divisions, a racial streak emerged in the community, further dividing the community and decreasing the strength of their resistance. |
||
The struggles of the Buttonwillow community still persist, and even as the residents make progress, they also face additional setbacks. Many of the myths that are often disproved by similar environmental justice cases apply to Buttonwillow. One of the primary myths initially believed by communities facing environmental injustice is that the government is “on our side.” According to Luke W. Cole, this myth is shared more widely among white Americans than among minorities, probably because minorities have historically faced several levels of governmental injustice.<ref name="White Myths">{{Citation |
The struggles of the Buttonwillow community still persist, and even as the residents make progress, they also face additional setbacks. Many of the myths that are often disproved by similar [[environmental justice]] cases apply to Buttonwillow. One of the primary myths initially believed by communities facing environmental injustice is that the government is “on our side.” According to Luke W. Cole, this myth is shared more widely among white Americans than among minorities, probably because minorities have historically faced several levels of governmental injustice.<ref name="White Myths">{{Citation |
||
| last=Cole |
| last=Cole |
||
| first=Luke W. |
| first=Luke W. |
||
| Line 305: | Line 316: | ||
==External links== |
==External links== |
||
{{sister project links|d=y|auto=y}} |
|||
{{sisterlinks|d=Q2347141|v=no|voy=Buttonwillow|m=no|mw=no|species=no|wikt=no|q=no|n=no|s=no|c=Kern County, California|b=no}} |
|||
*{{Curlie|Regional/North_America/United_States/California/Localities/B/Buttonwillow/}} |
*{{Curlie|Regional/North_America/United_States/California/Localities/B/Buttonwillow/}} |
||
{{Kern County, California}} |
{{Kern County, California}} |
||
Revision as of 05:32, 25 February 2024
Buttonwillow | |
|---|---|
 The entrance to Buttonwillow | |
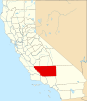
 Location in Kern County and the state of California | |
 Buttonwillow Location in the United States | |
| Coordinates: 35°24′02″N 119°28′10″W / 35.40056°N 119.46944°W | |
| Country | |
| State | |
| County | Kern |
| Government | |
| • Senate | Melissa Hurtado (D) |
| • Assembly | Rudy Salas (D) |
| • U. S. Congress | David Valadao (R) |
| Area | |
| • Total | 6.93 sq mi (17.94 km2) |
| • Land | 6.93 sq mi (17.94 km2) |
| • Water | 0.00 sq mi (0.00 km2) 0% |
| Elevation | 269 ft (82 m) |
| Population (2020) | |
| • Total | 1,337 |
| • Density | 193.01/sq mi (74.52/km2) |
| Time zone | UTC-8 (PST) |
| • Summer (DST) | UTC-7 (PDT) |
| ZIP code | 93206 |
| Area code | 661 |
| FIPS code | 06-09332 |
| GNIS feature ID | 1652678 |
Buttonwillow[3] is an unincorporated community and census-designated place in the San Joaquin Valley, in Kern County, California. Buttonwillow is 26 miles (42 km) west of Bakersfield,[3] at an elevation of 269 feet (82 m)).[2] The population was 1,508 at the 2010 census, up from 1,266 at the 2000 census. The center of population of California is located in Buttonwillow.[note 1]
History

The town was originally called Buena Vista when it was founded in 1895, but the name quickly became Buttonwillow.[3]
Buttonwillow was named for the buttonbush (Cephalanthus occidentalis). A lone buttonbush served as a landmark on an old trans-valley trail and was used by ancient Yokuts Indian as a meeting place, later becoming the site of settlers' stock rodeos. The Miller & Lux holdings company eventually established a headquarters and store near the tree.[5] This tree is listed as California Historical Landmark No. 492. This landmark is now known as the Buttonwillow Tree. California Historical Landmark reads:
- .NO. 492 BUTTONWILLOW TREE - This lone tree, which gave the town of Buttonwillow its name, served as a landmark on an old trans-valley trail. An ancient Yokuts Indian meeting place, it later became the site of settlers' stock rodeos. Miller and Lux established their headquarters and store here about 1885."[6]
The first United States Post Office at Buttonwillow was established in 1895.[3]
Facilities

Buttonwillow is a major stop for motorists traveling on Interstate 5. It includes gas stations, restaurants and travel centers. These are all at the exit of State Route 58.
There is a large electrical substation next to the town that is a part of a major north–south transmission corridor. It marks the northern end of Path 26 across the Transverse Ranges and the southern end of the Path 15 power lines. Buttonwillow is the motel hub for members of the Sports Car Club of America's Cal Club region when they hold events at Cal Club-owned Buttonwillow Raceway Park. Several motels are located there as well.
The town is also known for hosting the Best in the West jet rally, an annual gathering of model jet enthusiasts.[7]
Buttonwillow's main industry is cotton farming.[8]
Geography
According to the United States Census Bureau, Buttonwillow has an area of 6.9 square miles (18 km2), all of it land. Buttonwillow is also locally known as the cotton country, due to the abundant planting of cotton in the vicinity.
Beginning about four miles (6.4 km) south of town along Elk Hills Road, between Buttonwillow and Taft, is the enormous Elk Hills Oil Field, formerly the Naval Petroleum Reserve No. 1, which figured prominently in the Teapot Dome scandal that tarnished the administration of President Warren G. Harding. Occidental Petroleum bought the reserve from the U.S. Department of Energy in 1998, and is the current primary operator of the oil field.
Climate
Buttonwillow has a cold desert climate (BWk) typical of the southern part of California's Central Valley with hot, dry summers and cool winters.
| Climate data for Buttonwillow, California (1991–2020 normals, extremes 1940–present) | |||||||||||||
|---|---|---|---|---|---|---|---|---|---|---|---|---|---|
| Month | Jan | Feb | Mar | Apr | May | Jun | Jul | Aug | Sep | Oct | Nov | Dec | Year |
| Record high °F (°C) | 80 (27) |
85 (29) |
92 (33) |
100 (38) |
110 (43) |
114 (46) |
114 (46) |
114 (46) |
113 (45) |
102 (39) |
94 (34) |
81 (27) |
114 (46) |
| Mean maximum °F (°C) | 69.9 (21.1) |
76.0 (24.4) |
83.1 (28.4) |
91.6 (33.1) |
98.8 (37.1) |
104.3 (40.2) |
105.7 (40.9) |
105.3 (40.7) |
102.3 (39.1) |
94.0 (34.4) |
80.9 (27.2) |
70.5 (21.4) |
107.8 (42.1) |
| Mean daily maximum °F (°C) | 57.6 (14.2) |
64.0 (17.8) |
69.8 (21.0) |
76.0 (24.4) |
84.3 (29.1) |
92.4 (33.6) |
97.8 (36.6) |
96.6 (35.9) |
91.4 (33.0) |
80.8 (27.1) |
67.3 (19.6) |
58.2 (14.6) |
78.0 (25.6) |
| Daily mean °F (°C) | 47.5 (8.6) |
52.4 (11.3) |
57.5 (14.2) |
62.5 (16.9) |
70.2 (21.2) |
77.3 (25.2) |
82.7 (28.2) |
81.2 (27.3) |
75.8 (24.3) |
65.6 (18.7) |
54.1 (12.3) |
46.9 (8.3) |
64.5 (18.1) |
| Mean daily minimum °F (°C) | 37.5 (3.1) |
40.9 (4.9) |
45.3 (7.4) |
49.0 (9.4) |
56.1 (13.4) |
62.3 (16.8) |
67.7 (19.8) |
65.8 (18.8) |
60.1 (15.6) |
50.5 (10.3) |
40.8 (4.9) |
35.6 (2.0) |
51.0 (10.6) |
| Mean minimum °F (°C) | 27.9 (−2.3) |
31.0 (−0.6) |
35.4 (1.9) |
38.8 (3.8) |
46.4 (8.0) |
52.2 (11.2) |
59.2 (15.1) |
57.4 (14.1) |
50.7 (10.4) |
39.8 (4.3) |
30.1 (−1.1) |
25.9 (−3.4) |
24.5 (−4.2) |
| Record low °F (°C) | 9 (−13) |
19 (−7) |
26 (−3) |
30 (−1) |
38 (3) |
40 (4) |
38 (3) |
42 (6) |
37 (3) |
25 (−4) |
21 (−6) |
12 (−11) |
9 (−13) |
| Average precipitation inches (mm) | 1.19 (30) |
1.06 (27) |
1.15 (29) |
0.47 (12) |
0.27 (6.9) |
0.04 (1.0) |
0.07 (1.8) |
0.00 (0.00) |
0.03 (0.76) |
0.26 (6.6) |
0.46 (12) |
1.01 (26) |
6.01 (153) |
| Average precipitation days | 6.3 | 6.0 | 5.4 | 2.8 | 1.6 | 0.2 | 0.2 | 0.1 | 0.3 | 1.5 | 2.7 | 5.0 | 32.1 |
| Source: NOAA[9][10] | |||||||||||||
Demographics
| Census | Pop. | Note | %± |
|---|---|---|---|
| 2000 | 1,266 | — | |
| 2010 | 1,508 | 19.1% | |
| 2020 | 1,337 | −11.3% | |
| U.S. Decennial Census[11] | |||
2010
At the 2010 census Buttonwillow had a population of 1,508. The population density was 217.7 inhabitants per square mile (84.1/km2). The racial makeup of Buttonwillow was 534 (35.4%) White, 36 (2.4%) African American, 11 (0.7%) Native American, 10 (0.7%) Asian, 0 (0.0%) Pacific Islander, 890 (59.0%) from other races, and 27 (1.8%) from two or more races. Hispanic or Latino of any race were 1,183 persons (78.4%).[12]
The whole population lived in households, no one lived in non-institutionalized group quarters and no one was institutionalized.
There were 379 households, 225 (59.4%) had children under the age of 18 living in them, 217 (57.3%) were opposite-sex married couples living together, 64 (16.9%) had a female householder with no husband present, 39 (10.3%) had a male householder with no wife present. There were 36 (9.5%) unmarried opposite-sex partnerships, and 1 (0.3%) same-sex married couples or partnerships. 46 households (12.1%) were one person and 29 (7.7%) had someone living alone who was 65 or older. The average household size was 3.98. There were 320 families (84.4% of households); the average family size was 4.30.
The age distribution was 561 people (37.2%) under the age of 18, 162 people (10.7%) aged 18 to 24, 428 people (28.4%) aged 25 to 44, 265 people (17.6%) aged 45 to 64, and 92 people (6.1%) who were 65 or older. The median age was 26.5 years. For every 100 females, there were 110.0 males. For every 100 females age 18 and over, there were 111.9 males.
There were 406 housing units at an average density of 58.6 per square mile, of the occupied units 184 (48.5%) were owner-occupied and 195 (51.5%) were rented. The homeowner vacancy rate was 1.6%; the rental vacancy rate was 4.4%. 699 people (46.4% of the population) lived in owner-occupied housing units and 809 people (53.6%) lived in rental housing units.
2000
At the 2000 census there were 1,266 people, 328 households, and 270 families in the CDP. The population density was 181.7 inhabitants per square mile (70.2/km2). There were 364 housing units at an average density of 52.2 per square mile (20.2/km2). The racial makeup of the CDP was 34.28% White, 3.79% Black or African American, 1.66% Native American, 0.08% Asian, 55.06% from other races, and 5.13% from two or more races. 68.40% of the population were Hispanic or Latino of any race.[13] Of the 328 households 56.4% had children under the age of 18 living with them, 61.6% were married couples living together, 14.3% had a female householder with no husband present, and 17.4% were non-families. 15.2% of households were one person and 7.9% were one person aged 65 or older. The average household size was 3.81 and the average family size was 4.25.
The age distribution was 38.0% under the age of 18, 12.6% from 18 to 24, 27.6% from 25 to 44, 13.4% from 45 to 64, and 8.3% 65 or older. The median age was 24 years. For every 100 females, there were 107.2 males. For every 100 females age 18 and over, there were 106.6 males.
The median household income was $28,370 and the median family income was $29,716. Males had a median income of $19,514 versus $16,974 for females. The per capita income for the CDP was $9,424. About 23.1% of families and 28.7% of the population were below the poverty line, including 35.4% of those under age 18 and 11.8% of those age 65 or over.
Environment

This article is written like a personal reflection, personal essay, or argumentative essay that states a Wikipedia editor's personal feelings or presents an original argument about a topic. (January 2017) |
Buttonwillow, California, is the host to one of California's three toxic waste dumps: the Lokern Facility. The facility, owned and operated by a company then known as Laidlaw Environmental, which subsequently became Safety-Kleen and was later purchased in 2012 by Clean Harbors, lies eight miles (13 km) west of the community.[14] It was created in the 1970s, without the notification of any of the county's residents.[15] Furthermore, Highway 58, a busy road through the community, was used as the main route for trucks from the facility to transport toxic loads. At times, as many as 200 trucks would travel through the community per day.[14]
According to a study performed by Lisa Schweitzer, “transport spills [from toxic waste transporters, such as trucks] generally cluster near origins more than destinations." In the study, Schweitzer observed the amount of toxic waste that is spilled during transportation and the area where spills are generally located. If intermodal facilities and transfer points are considered origins, Laidlaw Environmental would qualify. Furthermore, the hundreds of trucks that transport toxic loads travel in and out of the community every day. Given the results of Schweitzer's study, the residents of nearby communities (Buttonwillow, especially) are at the highest risk of experiencing side effects from the spills. Generally, spills occur as a result of human error, in which the load was packaged incorrectly or the driver experienced a vehicle accident or some other force which allowed for the leaking of toxins.[16]
It was nearly ten years before the residents of Buttonwillow became aware of the facility. Even then, residents felt as if they could do nothing to stop it. In 1988, Laidlaw Environmental proposed to build a toxic waste incinerator, which would burn up to 108,000 short tons (216,000,000 lb; 98,000,000 kg) of toxic waste each year. Then in 1992, the birth and death of a child with a physical defect—anencephaly—stirred suspicion from several residents.[citation needed] The tragedy created a bond between these residents, and they began to look to Laidlaw Environmental and the toxins that it released as the root of the issue.
Also in 1992, Laidlaw Environmental proposed an expansion of its facility in Kern County. It wanted to double the dump's capacity, making it the largest in the United States. Furthermore, it wanted to change the types of chemicals it took from strictly petroleum waste to more than 450 different types of substances, many of which were highly toxic.[14] According to Juanita Fernandez, a resident of Buttonwillow, those in attendance at the community meeting which discussed the proposed acts appeared to be businessmen and women who were mostly of a Caucasian background.[14] The name of the committee in charge of the meeting was the Local Assessment Committee (LAC), which was formed in accordance with a law passed by California in the 1980s known as the Tanner Act. The law attempted to give county residents a say in the environmental occurrences and developments in their area. The LAC consisted of seven members, all of which met to discuss events and proposals such as those of Laidlaw Environmental.[17] Despite the apparent effort, the rules and regulations of the LAC were not fairly implemented. Even though LAC meetings were held in Buttonwillow, there were no residents from Buttonwillow on the committee. Furthermore, no members were of a Latino descent, although nearly all of Buttonwillow's residents belonged to this demographic group. While many Buttonwillow residents attempted to participate in meetings, there was no one in attendance who was willing to translate for Spanish speakers. Because the majority of Buttonwillow residents predominantly spoke Spanish, their presence at the meetings had little influence. Finally, in June 1992, a Spanish translator was provided at the meetings. One month later, the Local Assessment Committee was suspended indefinitely.[14]
In September 1994, the committee was reinstated. During the two-year span, a draft and final Environmental Impact Report (EIR) was designed for Laidlaw Environmental.[17] The EIR, required by the California Environmental Quality Act (CEQA), “examines the potential environmental impacts of many projects such as toxic waste dumps”.[14] In addition, speculation surrounded the decisions that were made in appointing new committee members. Many people believed the decisions were made based upon race rather than qualification. In fact, a white applicant was chosen over a Latino, even though this applicant had failed to submit their application. Because of the tension, the LAC decided to appoint a Latino member, Eduardo Montoya.[17]
After the application process, the LAC was told that it had ten weeks to convene and discuss the upcoming December hearing about the proposed expansion of Laidlaw Environmental. In this short amount of time, the LAC battled not with Laidlaw Environmental, but rather with the county. It appeared to many as if the county would not let the committee run their own meetings. The committee wanted control—the ability to set their own agenda and hire outside consultants. However, the county did not want to grant this authority to the LAC. Ten weeks later, in December, Laidlaw Environmental proceeded with the hearing and the Board of Supervisors disbanded the LAC. Montoya said that “the Board knew beforehand they would approve the dump” and that “they were just going through the motions”.[17]
A major divider in the struggle of Buttonwillow against Laidlaw Environmental was the issue of race. While the LAC could have spent time gathering community support and increasing awareness about the toxins, the committee members were instead battling racial discrimination and a debate with the county about Spanish translation. A local community group, known as Padres Hacia una Vida Mejor, worked for these particular rights.[18] Furthermore, the translation issue seemed to create a division among the county's residents. For example, in their efforts to institute Spanish translation of the EIR and public hearings, the Latino residents isolated themselves from the black and white people in the community. Many English-speaking residents did not support the translation and felt that speaking English was key if Latinos “wanted to live in [their] country”.[14] Because of these divisions, a racial streak emerged in the community, further dividing the community and decreasing the strength of their resistance.
The struggles of the Buttonwillow community still persist, and even as the residents make progress, they also face additional setbacks. Many of the myths that are often disproved by similar environmental justice cases apply to Buttonwillow. One of the primary myths initially believed by communities facing environmental injustice is that the government is “on our side.” According to Luke W. Cole, this myth is shared more widely among white Americans than among minorities, probably because minorities have historically faced several levels of governmental injustice.[19]
Notes
- ^ The coordinates of the center of population are at 35°27′31″N 119°21′19″W / 35.458606°N 119.355165°W.[4]
References
- ^ "2020 U.S. Gazetteer Files". United States Census Bureau. Retrieved October 30, 2021.
- ^ a b U.S. Geological Survey Geographic Names Information System: Buttonwillow, California
- ^ a b c d Durham, David L. (1998). California's Geographic Names: A Gazetteer of Historic and Modern Names of the State. Clovis, Calif.: Word Dancer Press. p. 1009. ISBN 1-884995-14-4.
- ^ "Population and Population Centers by State: 2000". United States Census 2000. US Census Bureau Geography Division. May 20, 2002. Archived from the original (TXT) on May 8, 2013. Retrieved December 26, 2009.
- ^ David W. Kean, Wide Places in the California Roads: The encyclopedia of California's small towns and the roads that lead to them (Volume 1 of 4: Southern California Counties), p. 19
- ^ californiahistoricallandmarks.com Landmark chl-492
- ^ "30th. Annual 2019 Best in the West Jet Rally".
- ^ David W. Kean, Wide Places in the California Roads: The encyclopedia of California's small towns and the roads that lead to them (Volume 1 of 4: Southern California Counties), p. 29
- ^ "Buttonwillow – NWS Hanford CA NOAA Online Weather Data". Retrieved February 10, 2021.
- ^ "U.S. Climate Normals Quick Access – Station: Buttonwillow, CA". National Oceanic and Atmospheric Administration. Retrieved May 26, 2023.
- ^ "Census of Population and Housing". Census.gov. Retrieved June 4, 2016.
- ^ "2010 Census Interactive Population Search: CA - Buttonwillow CDP". U.S. Census Bureau. Archived from the original on July 15, 2014. Retrieved July 12, 2014.
- ^ "U.S. Census website". United States Census Bureau. Retrieved January 31, 2008.
- ^ a b c d e f g Cole, Luke W. and Sheila R. Foster. 2001. "From The Ground Up". New York University Press: New York, NY.
- ^ Cole, Luke W. 1994. "Struggle of Kettleman City: Lesson for the Movement". Maryland Journal of Contemporary Legal Issues. Volume 67.
- ^ Schweitzer, Lisa (November 2006), "Environmental justice and hazmat transport: A spatial analysis in southern California", Transportation Research Part D: Transport and Environment, 11 (6), Amsterdam: 408–421, doi:10.1016/j.trd.2006.08.003
- ^ a b c d Cole, Luke W. (1999), "The Theory and Reality of Community-Based Environmental Decisionmaking: The Failure of California's Tanner Act and Its Implications for Environmental Justice", Ecology Law Quarterly, Berkeley, CA
- ^ Tan, Elizabeth. 1995. "The Grassroots Struggle for Environmental Justice: The Need for a New Approach to Public Health in Kern County, California".
- ^ Cole, Luke W. (Winter 2008), "Environmental Justice and the Three Great Myths of White Americana", West-Northwest Journal of Environmental Law and Policy, San Francisco, CA
External links
 Media from Commons
 Travel information from Wikivoyage
 Data from Wikidata