
Traffic collision: Difference between revisions
m Reverted edits by 69.141.22.53 (talk) to last version by Triskele Jim |
→Contributing Factors: minor copyedit, formatting of reference. (Well done for digging out the figures - I've been looking for those too!!) |
||
| Line 24: | Line 24: | ||
</blockquote> |
</blockquote> |
||
Using police crash reports as a source of data, a study by K. Rumar found that human factors |
Using more recent police crash reports from several countries as a source of data, a study by K. Rumar found that human factors, such as human error, fatigue, or intoxication by legal or illegal drugs, contributed wholly or partially to 93% of the crashes studied. Road or environmental factors contributed to 34%, and vehicle related-factors contributed to 12% of crashes.<ref name="Lum&Reagan">{{cite web | last = Harry Lum & Jerry A. Reagan | work = Interactive Highway Safety Design Model: Accident Predictive Module | publisher = Public Roads Magazine | date = Winter 1995 | url = http://www.tfhrc.gov/pubrds/winter95/p95wi14.htm }}</ref> These percentages add up to more than 100% because many crashes have more than one contributing factor. For example, if a driver loses control due to speeding on worn pavement with bad tires, the resulting crash would have a causative factor in each of the three categories. |
||
As the factors involved in collisions have been better understood, the term "accident" is sometimes avoided by some organisations |
As the factors involved in collisions have been better understood, the term "accident" is sometimes avoided by some organisations, as the word can suggest an unpredictable, unpreventable event. However, although these events are relatively rare in terms of the number of vehicles and drivers on the road, addressing the contributing factors can reduce the likelihood of collisions. That is why these organisations prefer the term "crash" or some other term. |
||
===Road design=== |
===Road design=== |
||
Revision as of 17:36, 23 February 2008

A car accident, sometimes called a car crash or car wreck, is an incident in which an automobile collides with anything that causes damage to the automobile, including other automobiles, telephone poles, buildings or trees, or in which the driver loses control of the vehicle and damages it in some other way, such as driving into a ditch or rolling over. Sometimes a car accident may also refer to an automobile striking a human or animal. Car crashes — also called road traffic accidents (RTAs), fender benders, traffic collisions, auto accidents, road accidents, personal injury collisions, motor vehicle accidents (MVAs), — kill an estimated 1.2 million people worldwide each year, and injure about forty times this number (WHO, 2004).
Contributing Factors
Many countries require the reporting and collection of road traffic accident statistics. Although the type of information collected differs between jurisdiction, this enables a figure to be produced for personal injuries and deaths to be produced, and correlated against a range of circumstances. It is then possible to attempt to group these circumstances in order to infer a cause, or causes for sets of accidents.
It has long been recognised that there may be a combination of factors, such as road conditions, weather environment, driver actions, or pedestrian actions, that contribute to an accident or road death. For example, an early study by J. J. Leeming, then responsible for the road network of the English county of Dorset, compared the circumstances around road deaths as reported in various American states (before the widespread introduction of 55 mph speed limits and drink-driving laws):[1]
'They took into account thirty factors which it was thought might affect the death rate. Among these were included the annual consumption of wine, of spirits and of malt beverages — taken individually — the amount spent on road maintenance, the minimum temperature, certain of the legal measures such as the amount spent on police, the number of police per 100,000 inhabitants, the follow-up programme on dangerous drivers, the quality of driver testing, and so on. The thirty factors were finally reduced to six on elimination of those which were found to have small or negligible effect. The final six were:
- (a) The percentage of the total state highway mileage that is rural.
- (b) The per cent increase in motor vehicle registration.
- (c) The extent of motor vehicle inspection.
- (d) The percentage of state-administered highway that is surfaced.
- (e) The average yearly minimum temperature.
- (f) The income per capita.
'These are placed in descending order of importance. These six accounted for 70% of the variations in the rate.'
Using more recent police crash reports from several countries as a source of data, a study by K. Rumar found that human factors, such as human error, fatigue, or intoxication by legal or illegal drugs, contributed wholly or partially to 93% of the crashes studied. Road or environmental factors contributed to 34%, and vehicle related-factors contributed to 12% of crashes.[2] These percentages add up to more than 100% because many crashes have more than one contributing factor. For example, if a driver loses control due to speeding on worn pavement with bad tires, the resulting crash would have a causative factor in each of the three categories.
As the factors involved in collisions have been better understood, the term "accident" is sometimes avoided by some organisations, as the word can suggest an unpredictable, unpreventable event. However, although these events are relatively rare in terms of the number of vehicles and drivers on the road, addressing the contributing factors can reduce the likelihood of collisions. That is why these organisations prefer the term "crash" or some other term.
Road design
A US study showed that about 34% of crashes had contributing factors related to the roadway or its environment. Most of these crashes also involved a human error.Cite error: A <ref> tag is missing the closing </ref> (see the help page). for most of the 20th Century planners have typically provided separate lanes, encouraging different classes of road user to progress independently at different speeds over an uncomplicated street design that is easy to interpret.[3]
A subsequent reappraisal of this approach has led to the redesign of junctions and the introduction of traffic calming measures in potentially hazardous areas to reduce the risk of collisions and to minimize the severity of injuries; pedestrian safety and access has been prioritized over car drivers' desires to make fast progress.
Vehicle design and maintenance

A well-maintained vehicle, with good brakes, tires and well-adjusted suspension will be more controllable in an emergency and thus be better equipped to avoid collisions. Some mandatory vehicle inspection schemes test for roadworthiness, such as the UK's MOT test or German TÜV conformance inspection.
The design of vehicles has also evolved to improve protection after collision. Initially this was a reaction to consumer pressure, after publications such as Ralph Nader's Unsafe at Any Speed accused motor manufacturers of indifference towards safety, and more latterly under government legislation, such as the Euro NCAP impact test. On close inspection, modern vehicles show design features such as thicker pillars, safety glass, and interiors with no sharp edges. Less obvious are the stronger bodies and other active or passive safety features. They also feature smooth exteriors to reduce the consequences of an impact with unprotected pedestrians.
In the UK the Department of Transport publishes road death and injury statistics for each type of accident and vehicle through its Road Casualties Great Britain report.[4] These statistics show a ten to one ratio of in-vehicle accident deaths between types of car. In most cars, occupants have a 2–8% chance of death in a two-car accident.
At the other extreme, motorcyclists have little protection other than their clothing; this difference is reflected in the death and accident statistics, where they are more than twice as likely to suffer severely after a collision. In 2005 in there were 198,735 road accidents with 271,017 reported casualties on roads in Great Britain. This included 3,201 deaths (1.1%) and 28,954 serious injuries (10.7%) overall. Of these casualties 178,302 (66%) were car users and 24,824 (9%) were motorcyclists, of whom 569 were killed (2.3%) and 5,939 seriously injured (24%).[5]

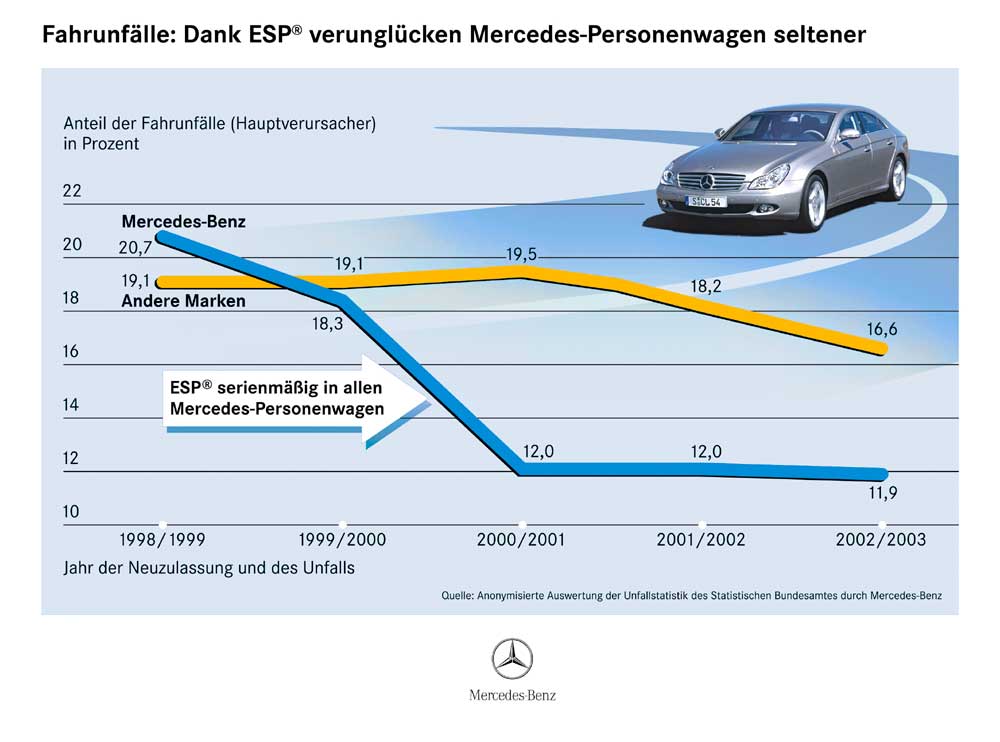
Research has shown that, across all accident types, it is less likely that seat belts were worn in accidents involving death or serious injury, rather than light injury; wearing a seat belt reduces the risk of death by about two thirds.[6] Some types of accident tend to have more serious consequences; rollovers have become more common in recent years, perhaps due to the increase in popularity of taller SUVs, people carriers and minivans which have more top weight than standard passenger cars. Rollovers can often be fatal, especially if the occupants are ejected because they were not wearing seat belts (83% of ejections during rollovers were fatal when the driver did not wear a seat belt, compared to 25% when they did).[6] After a new design of Mercedes Benz notoriously failed a 'moose test' (sudden swerving to avoid an obstacle), some manufacturers took efforts to enhance suspension using stability control linked to an anti-lock braking system in order to better address the risk of rollover. After retrofitting these systems to its models in 1999–2000, Mercedes saw its models feature in significantly fewer accidents[7]
Now about 40% of new US vehicles, mainly the SUVs, vans and pickup trucks that are more susceptible to rollover, are being produced with a lower center of gravity and enhanced suspension with stability control linked to its anti-lock braking system in order to better address the risk of rollover, and meet US federal requirements that will mandate anti-rollover technology by September 2011.[8]
Driver behaviour

Driver error, intoxication and other human factors contribute to about 93% of crashesCite error: A <ref> tag is missing the closing </ref> (see the help page). One survey of drivers reported that they thought the key elements were:[9]
- controlling a car including a good awareness of the car's size and capabilities
- reading and reacting to road conditions, weather, road signs and the environment
- alertness, reading and anticipating the behaviour of other drivers.
Although proficiency in these skills is taught and tested as part of the driving exam, a 'good' driver can still be at a high risk of accidents because:
"the feeling of being confident in more and more challenging situations is experienced as evidence of driving ability, and that 'proven' ability reinforces the feelings of confidence. Confidence feeds itself and grows unchecked until something happens – a near-miss or an accident".[9]
Professor Smeed noted that drivers constantly balance risks as they drive, leading road authorities to attempt to mitigate the worse consequences of mishaps through road design. Ever since Buchanan's Traffic in Towns report of 1963 urban planning has sought to separate vehicles from pedestrians and make the driver's job easier. As traffic levels have increased, accompanied by more interventions by planners and road safety teams, accident levels have reduced, but generally not as much as was hoped. This difference is generally attributed to road users' attitudes and behaviours.
Accompanying changes to road designs have been wide-scale adoptions of rules of the road alongside law enforcement policies that included drink-driving laws, setting of speed limits, and speed enforcement systems such as speed cameras, all with the intention of averting or reducing the severity of collisions. Some countries' driving tests have been expanded to test a new driver's behaviour during emergencies and hazard perception.
However, in spite of training, there are still demographic differences in accident rates. So, for example, although young people tend to have good reaction speeds, disproportionately more young male drivers feature in accidents,[10] with researchers observing that many exhibit behaviours and attitudes to risk that can place them in more hazardous situations than other road users.[9] This gets reflected by actuaries when they set insurance rates for different age groups, partly based on their age, sex, and choice of vehicle. Older drivers with slower reactions would be expected to be involved in more accidents, but this has not been the case as they tend to drive less and, apparently, more cautiously.[11]
Attempts to impose traffic policies can be complicated by local circumstances and driver behaviour. In 1969 Leeming warned that there is a balance to be struck when "improving" the safety of a road:[1]
It can safely be said that places which look dangerous do not have accidents, or very few. They happen at places which do not look dangerous. The reason for this is simple. The motorist is as intelligent as the 'local people'. If a place looks dangerous, he can see that it is, so he takes care and there are no accidents. He does not want to have an accident, and he will take care at obviously dangerous places. Accidents happen when there is some trap in road conditions which is not obvious at a glance, or where the conditions are too complicated for the limited human machine to deal with in the short time available. The driver has only a fraction of a second to size up a situation, and there may be some trap which he cannot see in this short time.'
This problem has been noted in risk compensation research, where the predicted reductions in accident rates have not occurred after legislative or technical changes. Instead, the introduction of improved brakes has heralded more aggressive driving,[12] while compulsory seat belt laws have not been accompanied by a clearly-attributed fall in overall fatalities.[13]
This approach was rethought in Woonerf and, more recently, Shared space urban traffic schemes, which propose a street environment and design that encourages the road user to be aware of potential hazards by interacting with pedestrians and other road traffic, and to naturally negotiate a more cautious style of driving.[14]
Driver impairment
A road user's capability is affected by the physical and mental ability to assess conditions and respond quickly. Studies[15] have established some common conditions that impair this judgement, including:
- poor eyesight and/or physical impairment, with many jurisdictions setting simple sight tests and/or requiring appropriate vehicle modifications before being allowed to drive;
- old age, with some jurisdictions requiring driver retesting for reaction speed and eyesight after a certain age;
- tiredness;
- excessive alcohol, with simple blood-alcohol limits enforced through drink-driving laws (although some level of impairment may occur below the legal limit);
- drug use - including some prescription drugs, over the counter drugs (notably antihistamines, opioids and muscarinic antagonists), and illegal drugs.
Several conditions can work together to create a much worse situation, for example:
- combining low doses of alcohol and cannabis has a more severe effect on driving performance than either cannabis or alcohol in isolation,[16] or
- taking recommended doses of several drugs together, which individually will not cause impairment, may combine to bring on drowsiness or other impairment. This could be more pronounced in an elderly person whose renal function is less efficient than a younger person's.[17]
Thus there are situations when a person may be impaired, but still legally allowed to drive, and becomes a potential hazard to themselves and other road users. Pedestrians or cyclists are affected in the same way and can similarly jeopardise themselves or others when on the road.
Research suggests that the driver's attention is affected by distracting sounds such as conversations and operating a mobile phone while driving. Many jurisdictions now restrict or outlaw the use of some types of phone within the car. Recent research conducted by British scientists suggests that music can also have an effect; classic music is considered to be calming, yet too much could relax the driver to a condition of distraction. On the other hand, hard-rock may encourage the driver to step on the acceleration pedal, thus creating a potentially dangerous situation on the road.[18]
Death and injury statistics
The ability to deliver prompt medical attention has also improved through improvements in ambulance and rescue equipment, availability of air ambulances, rapid response units, and paramedic training, while design changes have made collisions more survivable. Thus injuries from a collision that once would have been fatal may now be averted, while remote locations may report few accidents but with more fatalities.
For this reason modern accident statistics often focus on reportable injury accidents (which include deaths) rather than reporting on deaths alone. It is also believed that serious accidents are often significantly under-reported, under-recorded and misclassified[19] and that the completeness of reporting may vary over time and between sources.[20]
Local differences in requirements for reporting can sometimes make international comparisons of figures difficult.
Trends in collision statistics
Road toll figures show that car collision fatalities have declined since 1980, with most countries showing a reduction of roughly 50%.
In the United States, fatalities have increased slightly from 40,716 in 1994 to 42,884 in 2003. However, in terms of fatalities per 100 million miles driven, the fatality rate has dropped 16% between 1995 and 2005. Injuries dropped 37% over the same period. (National Traffic Safety Administration, 2006). In addition, there are many variables that have been shown to statistically correlate to car accidents, including: drunk driving, road type, age of driver, and gasoline prices.
It has been noted that road fatality trends tend to follow "Smeed's law" (named after R.J. Smeed, its author), an empirical rule relating injury rates to the two-thirds power of car ownership levels, and subsequently re-analysed by John Adams.[21]
Common types of collision
Statistics are typically gathered on the direction of impact, or impacts. The most common collisions on the road where both parties are moving involve:
- frontal impacts (most common)
- side impacts
- rear impacts
- rollovers (most rare)
In the USA rollovers have contributed to more than 10,000 deaths a year even though they only account for about 3 percent of all crashes.
Sometimes the vehicles in the collision can suffer more than one type of impact, such as during a shunt or high-speed spin.
Backup collisions
Backup collisions happen when a driver reverses the car into an object, person, or other car. Although most cars come equipped with rear view mirrors which are adequate for detecting vehicles behind a car, they are inadequate on many vehicles for detecting small children or objects close to the ground, which fall in the car's blind spot. Large trucks have much larger blind spots that can hide entire vehicles and large adults.
According to research by Kids and Cars – an organization devoted to preventing (non-traffic) motor-vehicle-related deaths and injuries – 49% of the non-traffic, non-crash fatalities involving children under 15 from 2001–2005 were caused by vehicles backing up.
The CDC reported that from 2001–2003, an estimated 7,475 children (2,492 per year) under the age of 15 were treated for automobile back-over incidents.
The US National Highway Traffic Safety Administration found that back-up collisions most often:[22]
- occur in residential driveways and parking lots
- involve sport utility vehicles (SUVs) or small trucks
- occur when a parent, relative or someone known to the family is driving
- particularly affect children less than five years old
The driver of the car backing up and hitting an object, a person, or another car is usually considered to be at fault.
Prevention organizations suggest that parents use common sense, and also take safety measures such as installing cross view mirrors, audible collision detectors, rear view video camera and/or some type of reverse backup sensors. Furthermore, safer backing up is done when the driver turns completely around and looks out of the rear window of the car, rather than relying on mirrors. This provides a wider field of vision and better control of the vehicle.
Legal consequences
The examples and perspective in this article may not represent a worldwide view of the subject. |
Car collisions usually carry legal consequences in proportion to the severity of the crash. Nearly all common law jurisdictions impose some kind of requirement that parties involved in a collision (even with only stationary property) must stop at the scene, and exchange insurance or identification information or summon the police. Failing to obey this requirement is referred to as hit and run and is generally a criminal offence. However, most claims are settled without recourse to law. In this case, assuming that both parties carry adequate insurance, the claim is often handled between the two insurers. There may be financial penalties involved, such as an excess or deductible payment and a loss of a no-claims bonus or higher future premiums.
Depending upon the circumstances, parties involved in an incident may face criminal liability, civil liability, or both. Usually, the state starts a criminal prosecution only if someone is severely injured or killed, or if one of the drivers involved was acting illegally or clearly grossly negligent or intoxicated or otherwise impaired at the time the accident occurred. Criminal charges might include driving under the influence of alcohol or drugs, driving without due care (UK), assault with a deadly weapon (USA), manslaughter, or murder; penalties range from fines to jail time (USA) to prison time to death (where applicable). It is notable that the penalties for killing and injuring with motor vehicles are often very much less than for other actions with similar outcomes.
As for civil liability, in places where healthcare is mainly provided through private insurance, such as the USA, automobile accident personal injury lawsuits have become the most common type of tort. Because of pre-existing case law, the courts usually need to decide only the factual questions of who is at fault, and their percentage of fault, as well as how much must be paid out in damages to the injured plaintiff by the defendant's insurer.
For lesser offences civil action may result in fines or collecting points that invalidate the driver's licence, through a central government agency. Such complaints may be filed by a police officer, by other witnesses of an incident, or through remote enforcement such as CCTV or speed cameras. Some jurisdictions (notably US states) directly administer fines or suspend licenses imposed by civil or criminal authorities when a driver has violated the rules of the road and thus the terms of a driver's license. In some jurisdictions such administrative penalties may be imposed through quasi-criminal infractions; other jurisdictions do not recognize infractions and charge all violations, at a minimum, as misdemeanours or felonies.
Some argue that the effect of a loss or injury due to a crash can be equivalent to that of a victim of crime under criminal law. Several campaigning organisations that provide support mechanisms also seek out an equivalent status within their jurisdictions[23] or draw attention to particular road safety issues and attitudes with the intention of introducing law reform (e.g. MADD).
Collision prevention
Mechanical systems
Although many crashes are caused by behavior that is difficult to alter, by mechanical failure, or by road conditions, some technical solutions have been proposed that would automatically detect how close the driver is to the car in front and warn the driver or automatically adjust the car's acceleration to prevent the car from getting closer than the distance in which it can safely stop.
- Parking sensors: These sensors give audible warnings at slow speed if the front or rear of the vehicle approach an object.
- Sobriety detectors: These interlocks prevent the ignition key from working if the driver breathes into one and it detects significant quantities of alcohol. They have been used by some commercial transport companies, or suggested for use with persistent drink-driving offenders on a voluntary basis[24]
- Drifting monitors: These devices monitor how close a vehicle is travelling to lane markers and, if it starts to drift toward or over the markers without the turn signal being activated, sounds an alarm.
Policies for avoiding collisions
Reasons suggested for young and inexperienced drivers being more likely to be in an accident include inexperience combined with over-confidence, peer pressure, a desire to show off, and even neurological development arguments.[25] It has been noticed that more of these types of serious collision occur at night, when the car has multiple occupants and when seat belt use is less.[9] This has led to some insurance companies and legislatures proposing:
- a "curfew" imposed on young drivers to prevent them driving at night
- an experienced supervisor to chaperone the less experienced driver
- forbidding the carrying of passengers
- zero alcohol tolerance
- raising the standards required for driving instructors and improving the driving test
- vehicle restrictions (e.g. restricting access to 'high performance' vehicles)
- a sign placed on the back of the vehicle (an N- or P-Plate) to notify other drivers of a novice driver
- encouraging good behaviour in the post-test period
To address accidents across all age ranges, some governments have also proposed measures such as:[26]
- addressing the needs of professional drivers
- encouraging employers to reduce work-related road safety risks
- wider adoption of advanced driving courses
- driver rehabilitation courses after serious traffic offences
Some countries or states have already implemented some of these ideas. This increased risk for the young is known to the insurance companies, and premiums sometimes reflect that; however, very high premiums for young drivers do not seem to have had a significant impact on the crash statistics. Recent initiatives by some insurers, such as pay-as-you-drive, have been attempts to incentivise better driving behaviour by rewarding young drivers who make better choices about where and when to drive. They also recognise the benefits of driver training beyond the statutory minimum and often offer premium reductions after completion of a course of advanced driving.
See also
- Unsafe at Any Speed
- Defensive driving
- Crash test
- Crash test dummy
- Driver visibility (List of visibility in cars)
- Vehicle extrication
- Road safety
- Transportation safety in the United States
- Pedestrian safety through vehicle design
- Roadside memorial
- List of road accidents
- In case of emergency (The "ICE" program)
- Tram accident
- Vehicle explosion
- Vehicular accident reconstruction
- Vehicle recovery
- Fatal Accident Reconstruction Team
- Totaled
Footnotes
- ^ a b Leeming, J.J. (1969). Road Accidents: Prevent or Punish?. ABD website. ISBN 0-304-93213-2.
{{cite book}}: CS1 maint: location missing publisher (link) - ^ Harry Lum & Jerry A. Reagan (Winter 1995). Interactive Highway Safety Design Model: Accident Predictive Module. Public Roads Magazine http://www.tfhrc.gov/pubrds/winter95/p95wi14.htm.
{{cite web}}: Missing or empty|title=(help) - ^ The Scaft Guidelines 1968: Principles for Urban Planning with Respect to Road Safety. Statens planverk (Swedish national board of urban planning) & Vägverket (Swedish National Road Administration). 1968.
{{cite book}}: Unknown parameter|note=ignored (help) - ^ "Annual transport accidents and casualties". Department for Transport.
{{cite web}}: Unknown parameter|accessed=ignored (help) - ^ Road Casualties in Great Britain, Main Results (Transport Statistics Bulletin ed.). Office of National Statistics. 2005.
{{cite book}}: Unknown parameter|accessed=ignored (help) - ^ a b Broughton & Walter (February 2007). Trends in Fatal Car Accidents: Analyses of data. Transport Research Laboratory.
{{cite book}}:|work=ignored (help) - ^ Fahrunfalle: Dank ESP verunglucken Mercedes-Personenwagen seltener (in German) (Graph of accident share), Mercedes Benz, retrieved 2007-12-28,
Road accidents are rare with ESP Mercedes passenger cars
- ^ U.S. to Require Anti-Rollover Technology on New Cars by 2012, Insurance Journal, 2006-09-15, retrieved 2007-12-28
- ^ a b c d "The Good, the Bad and the Talented: Young Drivers' Perspectives on Good Driving and Learning to Drive" (PDF) (Road Safety Research Report No. 74 ed.). Transport Research Laboratory. January 2007.
{{cite web}}: Unknown parameter|accessed=ignored (help) - ^ Thew, Rosemary (2006). "[[Royal Society for the Prevention of Accidents]] Conference Proceedings" (PDF). Driving Standards Agency.
{{cite web}}: URL–wikilink conflict (help); Unknown parameter|note=ignored (help) - ^ "forecasting older driver's accident rates". Department for Transport.
- ^ Sagberg, Fosser, & Saetermo (1997). An investigation of behavioural adaptation to airbags and antilock brakes among taxi drivers (29 ed.). p. 293–302.
{{cite book}}: Unknown parameter|publication=ignored (help)CS1 maint: multiple names: authors list (link) - ^ Adams, John (1982). "The efficacy of seat belt legislation" (PDF). SAE Transactions.
- ^ "Research projects, Theme 3: Impairment" (Policy, guidance and research ed.). UK Department for Transport.
{{cite web}}: Unknown parameter|accessed=ignored (help) - ^ "Road Safety Part 1: Alcohol, drugs, ageing & fatigue" (Research summary, TRL Report 543 ed.). UK Department for Transport. Spring 2003.
{{cite web}}: Unknown parameter|accessed=ignored (help) - ^ "Road Safety Part 1: Alcohol, drugs, ageing & fatigue" (Research summary, Transport Research Laboratory Road Safety Report No. 24 ed.). UK Department for Transport. Spring 2003.
{{cite web}}: Unknown parameter|accessed=ignored (help) - ^ Hard-Rock and Classic Music Could Lead to Road Accidents, New Survey Says
- ^ Simpson, H F. Comparison of hospital and police casualty data: a national study (TRL Report 173 ed.). Transport Research Laboratory.
there may be 2.76 times as many seriously injured casualties than are recorded in the national casualty figures and 1.70 slight casualties
- ^ Gill, Goldacre, & Yeates (2006-06-23). "Changes in safety on England's roads: analysis of hospital statistics". British medical Journal.
{{cite web}}: CS1 maint: multiple names: authors list (link) - ^ Adams, John. "Smeed's Law : some further thoughts" (PDF). University College London.
- ^ Deaths and Injuries Resulting from Certain Non-Traffic and Non-Crash Events. US National Highway Traffic Safety Administration. May 2004.
- ^ "Government continues to give bereaved and injured road traffic victims fewer rights than to victims of even the most trivial property crimes". Roadpeace.
{{cite web}}: Unknown parameter|accessed=ignored (help) - ^ "Primary and secondary prevention of drink driving by the use of alcolock device and program: Swedish experiences". Accident Analysis & Prevention. November 2005.
{{cite web}}: Unknown parameter|Edition=ignored (|edition=suggested) (help); Unknown parameter|accessed=ignored (help) - ^ Williamson, Elizabeth (2005-02-01). "Brain Immaturity Could Explain Teen Crash Rate". Washington Post.
- ^ Castle& Kamya-Lukoda (July 2006). "Review of Road Safety Good Practice in English Local Authorities" (MS Word). TRL for Audit Commission.
External links
- Early Auto Accidents A collection of photographs of auto accidents from the 1920s to 1950s
- Car Crashes Different crashes caught on tape.
- U.S. DOT Fatality Analysis Reporting System FARS
- Frontal and Side car crash video in slow motion
- Car Accident Photos. Thousands of accident images and stories arranged in different galleries
- The Quiet Horror, a critical column by Doug Damerst
- Hints, Tips and Awareness of the dangers of inexperienced driving