
Cloud cover: Difference between revisions
Citation bot (talk | contribs) Removed parameters. | Use this bot. Report bugs. | Suggested by Jay8g | Category:CS1 maint: url-status | #UCB_Category 500/758 |
|||
| (39 intermediate revisions by 26 users not shown) | |||
| Line 1: | Line 1: | ||
{{short description|Fraction of the sky obscured by clouds when observed from a particular location}} |
|||
| ⚫ | |||
[[File:Total cloud cover.png|thumb|Total cloud cover fraction averaged over the years 1981-2010 from the CHELSA-BIOCLIM+ data set<ref>Brun, P., Zimmermann, N.E., Hari, C., Pellissier, L., Karger, D.N. (preprint): Global climate-related predictors at kilometre resolution for the past and future. Earth Syst. Sci. Data Discuss. https://doi.org/10.5194/essd-2022-212</ref>]] |
|||
| ⚫ | |||
| ⚫ | '''Cloud cover''' (also known as '''cloudiness''', '''cloudage''', or '''cloud amount''') refers to the fraction of the [[sky]] obscured by [[cloud]]s when observed from a particular location.<ref>{{cite book |last=Huschke |first= Ralph E. | |
||
| ⚫ | '''Cloud cover''' (also known as '''cloudiness''', '''cloudage''', or '''cloud amount''') refers to the fraction of the [[sky]] obscured by [[cloud]]s on average when observed from a particular location.<ref>{{cite book |last=Huschke |first= Ralph E. |orig-year=1959 |url=http://glossary.ametsoc.org/wiki/Cloud_cover |entry=Cloud cover |publisher=[[American Meteorological Society]] |title=Glossary of Meteorology |location=Boston |edition=2nd |year=1970 |access-date=2013-08-24}}</ref> [[Okta]] is the usual unit for measurement of the cloud cover. The cloud cover is correlated to the [[sunshine duration]] as the least cloudy locales are the sunniest ones while the cloudiest areas are the least sunny places, as clouds can block sunlight, especially at [[sunrise]] and [[sunset]] where sunlight is already limited. |
||
| ⚫ | |||
| ⚫ | |||
| ⚫ | |||
| ⚫ | |||
| ⚫ | |||
| ⚫ | |||
| last1 = Stubenrauch | first1 = C. J. |
| last1 = Stubenrauch | first1 = C. J. |
||
| last2 = Rossow | first2 = W. B. |
| last2 = Rossow | first2 = W. B. |
||
| Line 35: | Line 38: | ||
| pages = 1031–1049 |
| pages = 1031–1049 |
||
| doi = 10.1175/BAMS-D-12-00117.1 |
| doi = 10.1175/BAMS-D-12-00117.1 |
||
| bibcode = 2013BAMS...94.1031S| url = https://hal.archives-ouvertes.fr/hal-01091218/file/bams-d-12-001172E1.pdf |
| bibcode = 2013BAMS...94.1031S| s2cid = 12145499 |
||
| url = https://hal.archives-ouvertes.fr/hal-01091218/file/bams-d-12-001172E1.pdf |
|||
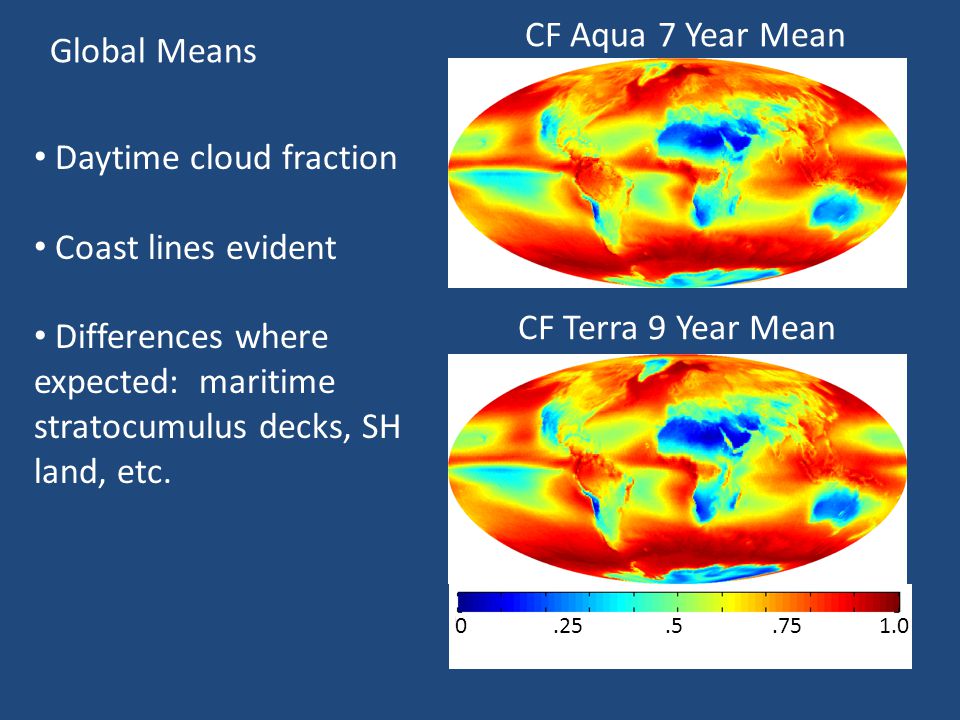
}}</ref> Average cloud cover is around 72% over the oceans, with low seasonal variation, and about 55% above land, with significant seasonal variation.<ref name="King Platnick Menzel Ackerman 2013 pp. 3826–3852">{{cite journal | last1=King | first1=Michael D. | last2=Platnick | first2=Steven | last3=Menzel | first3=W. Paul | last4=Ackerman | first4=Steven A. | last5=Hubanks | first5=Paul A. | title=Spatial and Temporal Distribution of Clouds Observed by MODIS Onboard the Terra and Aqua Satellites | journal=IEEE Transactions on Geoscience and Remote Sensing | publisher=Institute of Electrical and Electronics Engineers (IEEE) | volume=51 | issue=7 | year=2013 | issn=0196-2892 | doi=10.1109/tgrs.2012.2227333 | pages=3826–3852| bibcode=2013ITGRS..51.3826K | doi-access=free | hdl=2060/20120010368 | hdl-access=free }}</ref> |
|||
}}</ref> |
|||
== Role in the climate system == |
== Role in the climate system == |
||
| ⚫ | Clouds play multiple critical roles in the [[climate system]] and [[diurnal cycle]]. In particular, being bright objects in the visible part of the [[sun|solar]] [[spectrum]], they efficiently reflect light to space and thus contribute to the cooling of the planet, as well as trapping remaining heat at [[night]]. Cloud cover thus plays an important role in the energetic balance of the atmosphere and a variation of it is a factor and consequence of and to the [[climate change]] expected by recent studies.<ref>{{Cite report | url= http://www.grida.no/publications/other/ipcc_tar/?src=/climate/ipcc_tar/ | title= IPCC Third Assessment Report Chapter 7. Physical Climate Processes and Feedbacks (Atmospheric Processes and Feedbacks 7.2) | publisher= International Panel on Climate Change | access-date= August 24, 2013 | quote= It has extensive coverage of cloud-climate interactions | archive-url= https://web.archive.org/web/20130805091249/http://www.grida.no/publications/other/ipcc_tar/?src=%2Fclimate%2Fipcc_tar%2F | archive-date= August 5, 2013 | url-status= dead }}</ref> |
||
[[File:Worldclouds 2009.jpg|thumb|right|Global cloud cover, averaged over the month of October, 2009. The image shows that the outlines of the continents can often be traced through observations of clouds alone, with the sharpest outlines where very dry land is surrounded by ocean.]] |
|||
| ⚫ | Clouds play multiple critical roles in the [[climate system]]. In particular, being bright objects in the visible part of the [[sun|solar]] [[spectrum]], they efficiently reflect light to space and thus contribute to the cooling of the planet. Cloud cover thus plays an important role in the energetic balance of the atmosphere and a variation of it is a consequence of and to the [[climate change]] expected by recent studies.<ref>{{Cite report | url= http://www.grida.no/publications/other/ipcc_tar/?src=/climate/ipcc_tar/ | title= IPCC Third Assessment Report Chapter 7. Physical Climate Processes and Feedbacks (Atmospheric Processes and Feedbacks 7.2) | publisher= International Panel on Climate Change | |
||
== Variability == |
== Variability == |
||
[[File:MODAL2 M CLD FR.ogv|thumb| |
[[File: MODAL2 M CLD FR.ogv|thumb|The average cloud cover of the Earth, 2005-2013. Colors range from blue (no clouds) to white (totally cloudy).<ref>{{Cite web |date=2018-10-31 |others=Webmaster Paul Przyborski; NASA Official Robert Levy |title=Cloud Fraction |url=http://earthobservatory.nasa.gov/GlobalMaps/view.php?d1=MODAL2_M_CLD_FR |website=NASA Earth Observatory}}</ref> (''click for more detail'')]] |
||
Cloud cover values only vary by |
Cloud cover values only vary by 3% from year to year averages, whereas the local, day to day variability in cloud amount typically rises to 30% over the globe. Most data sets agree on the fact that the land is covered by 10-15% less cloud than the oceans. This is due to the seas being covered with water, meaning much more [[evaporation]] is possible.<ref name = "2013stubenrauch" /> |
||
Lastly, there is a latitudinal variation in the cloud cover, such that around 20°N there are regions with |
Lastly, there is a latitudinal variation in the cloud cover, such that around 20°N there are regions with 10% lower cloudiness than the global mean. Similar variation (15%) is found at 20°S. This is because of the absence of equatorial effects and strong winds reducing cloud formation.{{Specify|date=May 2023}} On the other hand, in the storm regions of the Southern Hemisphere midlatitudes were found to have with 15–25% more cloudiness than the global mean at 60°S.<ref name = "2013stubenrauch" /> On average, about 67% of the entire Earth is cloud-covered at any moment.<ref name="NASA Earth Observatory 2020">{{cite web | title=Cloudy Earth | website=NASA Earth Observatory | date=2020-07-07 | url=https://earthobservatory.nasa.gov/images/85843/cloudy-earth | access-date=2022-01-29}}</ref> |
||
On a continental scale, it can be noticed based upon a long-term satellite recording of cloudiness data that on a year-mean basis, [[Europe]], [[North America]], [[South America]] and [[Asia]] are dominated by cloudy skies. On the other hand, [[Africa]], the [[Middle East]] and [[Australia]] are dominated by clear skies.<ref name="images.slideplayer.com">https://images.slideplayer.com/17/5328401/slides/slide_4.jpg</ref> |
On a continental scale, it can be noticed based upon a long-term satellite recording of cloudiness data that on a year-mean basis, [[Europe]], [[North America]], [[South America]] and [[Asia]] are dominated by cloudy skies due to the [[westerlies]], [[Monsoon of South Asia|monsoon]] or other effects. On the other hand, [[Africa]], the [[Middle East]] and [[Australia]] are dominated by clear skies due to their continentality and [[aridity]].<ref name="images.slideplayer.com">https://images.slideplayer.com/17/5328401/slides/slide_4.jpg {{Bare URL image|date=March 2022}}</ref> |
||
| ⚫ | On a regional scale, some exceptionally humid areas of Earth experience cloudy conditions virtually all time such as South America's [[Amazon Rainforest]] while some highly arid areas experience clear-sky conditions virtually all the time such as Africa's [[Sahara Desert]].<ref name="images.slideplayer.com"/> |
||
== Altitude of typical cloud cover == |
|||
Although clouds can exist within a wide range of altitudes, typical cloud cover has a base at approximately 4,000m and extends up to an altitude of about 5,000m.<ref>{{Cite web |date=2012 |title=Met Office introduction to clouds |url=https://www.metoffice.gov.uk/binaries/content/assets/metofficegovuk/pdf/research/library-and-archive/library/publications/factsheets/factsheet_1-clouds.pdf |website=Met Office (UK)}}</ref> Clouds height can vary depending on latitude; with cloud cover in polar latitudes being slightly lower and in tropical regions the cloud cover may extend up to 8,000m. The [[List of cloud types|type of cloud]] is also a factor, with low [[cumulus cloud]]s sitting at 300–1,500m while high [[cirrus cloud]]s at 5,500-6,500m. |
|||
| ⚫ | On a regional scale, |
||
{{Weather}} |
{{Weather}} |
||
{{ |
{{clear}} |
||
== References == |
== References == |
||
{{ |
{{Reflist}} |
||
* McIntosh, D. H. (1972) ''Meteorological Glossary'', Her Majesty's Stationery Office, Met. O. 842, A.P. 897, 319 p. |
* McIntosh, D. H. (1972) ''Meteorological Glossary'', Her Majesty's Stationery Office, Met. O. 842, A.P. 897, 319 p. |
||
== External links == |
== External links == |
||
{{Commons |
{{Commons}} |
||
* [https://web.archive.org/web/20050420085336/http://www.nsdl.arm.gov/Library/glossary.shtml#Cloud_cover NSDL.arm.gov], ''Glossary of Atmospheric Terms'', From the National Science Digital Library's [https://web.archive.org/web/20021123031727/http://nsdl.arm.gov/ Atmospheric Visualization Collection]. |
* [https://web.archive.org/web/20050420085336/http://www.nsdl.arm.gov/Library/glossary.shtml#Cloud_cover NSDL.arm.gov], ''Glossary of Atmospheric Terms'', From the National Science Digital Library's [https://web.archive.org/web/20021123031727/http://nsdl.arm.gov/ Atmospheric Visualization Collection]. |
||
* [http://earthobservatory.nasa.gov/GlobalMaps/view.php?d1=MODAL2_M_CLD_FR# Earthobersvatory.nasa.gov], Monthly maps of global cloud cover from NASA's [[Earth Observatory]] |
* [http://earthobservatory.nasa.gov/GlobalMaps/view.php?d1=MODAL2_M_CLD_FR# Earthobersvatory.nasa.gov], Monthly maps of global cloud cover from NASA's [[Earth Observatory]] |
||
* [http://isccp.giss.nasa.gov/# International Satellite Cloud Climatology Project (ISCCP)], '' NASA's data products on their satellite observations '' |
* [http://isccp.giss.nasa.gov/# International Satellite Cloud Climatology Project (ISCCP)], '' NASA's data products on their satellite observations '' |
||
* [http://earthobservatory.nasa.gov/images/imagerecords/41000/41292/cldfrc_TMO_200910_lrg.png NASA composite satellite image]. |
* [https://web.archive.org/web/20100212071052/http://earthobservatory.nasa.gov/images/imagerecords/41000/41292/cldfrc_TMO_200910_lrg.png NASA composite satellite image]. |
||
{{Authority control}} |
|||
[[Category:Clouds]] |
[[Category:Clouds]] |
||
[[Category:Articles containing video clips]] |
[[Category:Articles containing video clips]] |
||
[[Category:Atmospheric dynamics]] |
|||
[[fr:Nuage#Nébulosité et opacité]] |
[[fr:Nuage#Nébulosité et opacité]] |
||
Latest revision as of 08:31, 12 February 2024


Cloud cover (also known as cloudiness, cloudage, or cloud amount) refers to the fraction of the sky obscured by clouds on average when observed from a particular location.[2] Okta is the usual unit for measurement of the cloud cover. The cloud cover is correlated to the sunshine duration as the least cloudy locales are the sunniest ones while the cloudiest areas are the least sunny places, as clouds can block sunlight, especially at sunrise and sunset where sunlight is already limited.


The global cloud cover averages around 67-68%, though it ranges from 56% to 73% depending on the minimum optical depth considered (lower when optical depth is large, and higher when it is low, such that subvisible cirrus clouds are counted).[3] Average cloud cover is around 72% over the oceans, with low seasonal variation, and about 55% above land, with significant seasonal variation.[4]
Role in the climate system[edit]
Clouds play multiple critical roles in the climate system and diurnal cycle. In particular, being bright objects in the visible part of the solar spectrum, they efficiently reflect light to space and thus contribute to the cooling of the planet, as well as trapping remaining heat at night. Cloud cover thus plays an important role in the energetic balance of the atmosphere and a variation of it is a factor and consequence of and to the climate change expected by recent studies.[5]
Variability[edit]
Cloud cover values only vary by 3% from year to year averages, whereas the local, day to day variability in cloud amount typically rises to 30% over the globe. Most data sets agree on the fact that the land is covered by 10-15% less cloud than the oceans. This is due to the seas being covered with water, meaning much more evaporation is possible.[3]
Lastly, there is a latitudinal variation in the cloud cover, such that around 20°N there are regions with 10% lower cloudiness than the global mean. Similar variation (15%) is found at 20°S. This is because of the absence of equatorial effects and strong winds reducing cloud formation.[specify] On the other hand, in the storm regions of the Southern Hemisphere midlatitudes were found to have with 15–25% more cloudiness than the global mean at 60°S.[3] On average, about 67% of the entire Earth is cloud-covered at any moment.[7]
On a continental scale, it can be noticed based upon a long-term satellite recording of cloudiness data that on a year-mean basis, Europe, North America, South America and Asia are dominated by cloudy skies due to the westerlies, monsoon or other effects. On the other hand, Africa, the Middle East and Australia are dominated by clear skies due to their continentality and aridity.[8]
On a regional scale, some exceptionally humid areas of Earth experience cloudy conditions virtually all time such as South America's Amazon Rainforest while some highly arid areas experience clear-sky conditions virtually all the time such as Africa's Sahara Desert.[8]
Altitude of typical cloud cover[edit]
Although clouds can exist within a wide range of altitudes, typical cloud cover has a base at approximately 4,000m and extends up to an altitude of about 5,000m.[9] Clouds height can vary depending on latitude; with cloud cover in polar latitudes being slightly lower and in tropical regions the cloud cover may extend up to 8,000m. The type of cloud is also a factor, with low cumulus clouds sitting at 300–1,500m while high cirrus clouds at 5,500-6,500m.
| Part of a series on |
| Weather |
|---|
|
|
References[edit]
- ^ Brun, P., Zimmermann, N.E., Hari, C., Pellissier, L., Karger, D.N. (preprint): Global climate-related predictors at kilometre resolution for the past and future. Earth Syst. Sci. Data Discuss. https://doi.org/10.5194/essd-2022-212
- ^ Huschke, Ralph E. (1970) [1959]. "Cloud cover". Glossary of Meteorology (2nd ed.). Boston: American Meteorological Society. Retrieved 2013-08-24.
- ^ a b c Stubenrauch, C. J.; Rossow, W. B.; Kinne, S.; Ackerman, S.; Cesana, G.; Chepfer, H; Di Girolamo, L.; Getzewich, B.; Guignard, A.; Heidinger, A.; Maddux, B. C.; Menzel, W.P; Minnis, P.; Pearl, C.; Platnick, S.; Poulsen, C.; Reidi, J.; Sun-Mack, S; Walther, A.; Winker, D.; Zeng, S.; Zhao, G. (2013). "Assessment of global cloud datasets from satellites: Project and Database initiated by GEWEX Radiation Panel" (PDF). Bulletin of the American Meteorological Society. 94 (7): 1031–1049. Bibcode:2013BAMS...94.1031S. doi:10.1175/BAMS-D-12-00117.1. S2CID 12145499.
- ^ King, Michael D.; Platnick, Steven; Menzel, W. Paul; Ackerman, Steven A.; Hubanks, Paul A. (2013). "Spatial and Temporal Distribution of Clouds Observed by MODIS Onboard the Terra and Aqua Satellites". IEEE Transactions on Geoscience and Remote Sensing. 51 (7). Institute of Electrical and Electronics Engineers (IEEE): 3826–3852. Bibcode:2013ITGRS..51.3826K. doi:10.1109/tgrs.2012.2227333. hdl:2060/20120010368. ISSN 0196-2892.
- ^ IPCC Third Assessment Report Chapter 7. Physical Climate Processes and Feedbacks (Atmospheric Processes and Feedbacks 7.2) (Report). International Panel on Climate Change. Archived from the original on August 5, 2013. Retrieved August 24, 2013.
It has extensive coverage of cloud-climate interactions
- ^ "Cloud Fraction". NASA Earth Observatory. Webmaster Paul Przyborski; NASA Official Robert Levy. 2018-10-31.
{{cite web}}: CS1 maint: others (link) - ^ "Cloudy Earth". NASA Earth Observatory. 2020-07-07. Retrieved 2022-01-29.
- ^ a b https://images.slideplayer.com/17/5328401/slides/slide_4.jpg [bare URL image file]
- ^ "Met Office introduction to clouds" (PDF). Met Office (UK). 2012.
- McIntosh, D. H. (1972) Meteorological Glossary, Her Majesty's Stationery Office, Met. O. 842, A.P. 897, 319 p.
External links[edit]
- NSDL.arm.gov, Glossary of Atmospheric Terms, From the National Science Digital Library's Atmospheric Visualization Collection.
- Earthobersvatory.nasa.gov, Monthly maps of global cloud cover from NASA's Earth Observatory
- International Satellite Cloud Climatology Project (ISCCP), NASA's data products on their satellite observations
- NASA composite satellite image.