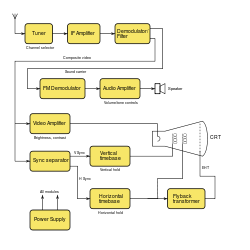
Block diagram
A block diagram is the graphic representation of the effects between several interacting components , which is mainly used in technology .
In contrast to the electrical circuit diagram , however, concrete connections (such as electrical lines) between concrete components are not shown, but the effects between the functional units shown as blocks.
Block diagrams are used in electrical engineering , e.g. B. used in computer technology , communications technology , or in control engineering .
Block diagrams in electrical engineering
In electrical engineering , an overview circuit diagram, which consists of function blocks and their connections (signals, lines) as well as input and output lines of the overall circuit, is referred to as a block diagram. Signals (cables) are represented with lines, while function blocks are represented with geometric shapes (mostly rectangles). Names of the individual signals and blocks can be added.
A block diagram shows the time-independent structure of the circuit. This facilitates the synthesis and analysis of complex circuits. In addition, the possible paths of a signal through the circuit are visualized. This enables the critical path of a circuit to be determined. Each block leads to a delay in the signal. The critical path is the path with the greatest overall delay. A stable signal can only be measured at the output after the critical time has elapsed.
A block diagram serves to illustrate the functional relationships of complex systems. An electrical circuit diagram is often insufficient for understanding. When realizing electronic components, a circuit diagram is nevertheless necessary, since it also serves as the basis for circuit synthesis (e.g. circuit board layout ).
Block diagrams in control engineering

In control engineering , block diagrams with a mathematical description are used. These are called the signal flow plan . There the rectangles ( nodes , blocks) stand for dynamic or static systems , the arrows (directed edges ) represent couplings between the systems. Each block has input and output signals that can change over time.
The causal direction of action of the signals is clearly defined by the direction of the arrow. When creating the block diagram, it is assumed that the subsequent system part (load) has no effect on the output of a block, i.e. that the block has no reaction. The arrow points from the point of origin of the signal to the block in which the signal is the cause of other processes.
A block can combine several subsystems or represent an elementary link. There is an overview of the transmission links in the article signal flow diagram . With the help of the signal flow algebra, the transfer function of the overall system can be determined from the block diagram .
See also
literature
- Jan Lunze: Control engineering , Springer Verlag, Vol. 1 (2005) ISBN 3-540-28326-9 , Vol. 2 (2006) ISBN 3-540-32335-X .
- Heinz Unbehauen: Control engineering , Vieweg, Braunschweig / Wiesbaden, Vol. 1 (2005) ISBN 3-528-93332-1 , Vol. 2 (2000) ISBN 3-528-73348-9 .
