Buddha bread
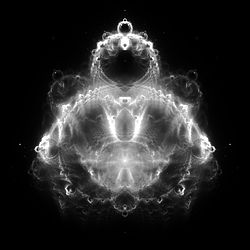
The Buddha bread is a special representation of a crowd and is closely related to the Mandelbrot crowd .
The picture got its name because of its similarity to classical depictions of the meditating Gautama Buddha , with a forehead point (tikka) and his traditional topknot ( ushnisha ) .
discovery
The method for rendering the Buddhabrot was discovered by Melinda Green, and later in a Usenet described -contribution from 1993 to sci.fractals.
Before that, other scientists had come very close to the Buddha bread technique. In 1988, Linas Vepstas passed similar images on to Clifford Pickover , who was to publish them in his book Computer, Pattern, Chaos, and Beauty . This led to the discovery of the pickover stalks ( sheaf (math) # stalks and germs ). Pickover and Vepstas did not filter out the non-diverging trajectories , which is necessary in order to create the ghostly-looking images that are strongly reminiscent of Hindu art.
Green first called the picture Ganesh because an Indian employee recognized the elephant-headed god Ganesha in the picture .
The name Buddha bread was later coined by Lori Gardi .
Rendering method
The Mandelbrot set is the set of points in the complex plane for which the recursively defined sequence
with remains limited, that is, does not diverge towards infinity .
The Buddha bread is rendered by first creating a 2-dimensional array of counters, with a counter assigned to each pixel of the image. The counters are initialized with zero. Then arbitrarily selected points are iterated by the Mandelbrot function.
Points which diverge towards infinity after a selected maximum number of iterations and therefore do not belong to the Mandelbrot set are iterated again by the Mandelbrot function and the trace left behind is entered in the array.
After iterating a large number of c values, gray levels are selected based on the counts stored in the array. The result is a density distribution that highlights regions where the iteration values (z-values) "spend most of the time" on their way to infinity.
The image can also be viewed as a probability distribution : the light regions have a higher probability that trajectories run through the region, and the darker regions a lower probability.
Nuances
Rendering a Buddha bread representation is generally more computationally intensive than rendering an ordinary Mandelbrot. This is partly due to the fact that more random points must be iterated than the image has pixels in order to generate a sharp image. The rendering of greatly enlarged areas requires more computing time than with normal Mandelbrot images, in which a pixel can be calculated directly and independently of the magnification. Conversely, a pixel in a greatly enlarged area of a Buddha bread can be influenced by starting points that are far outside the region actually in focus. If you do not want to resort to more complex probabilistic techniques, the representation is an enlarged detail of a Buddhabrot merely cutting out the magnified area of a complete, very large rendering.
The number of iterations chosen has a strong influence on the image - higher values result in a sparse, higher-contrast image, because a few points cross a large number of pixels before they diverge towards infinity, which makes their tracks stand out more. Within a lower number of iterations, these points would not diverge, and consequently would not be recognized as divergent, and would therefore not be included in the image.
Green later realized that this was an easy way to color Buddha bread representations. To do this, you combine three grayscale images , which differ only in the maximum number of iterations, into a single color image. The same method is used in astronomy to create false color images of nebulae and other celestial objects.
For example, you could assign an image with a maximum of 2000 iterations to the red channel, an image with 200 iterations to the green channel and an image with 20 iterations to the blue channel of the RGB color space , and thus generate the color image. Buddha bread that is produced with this technique are Nebulabrot called.
The plotting of the traces of those points that do not diverge up to a selected minimum number of iterations (for example 1,000 or 1,000,000) leads to representations in which different areas of the Buddha bread are more clearly visible in detail.
Another technique is that only traces of those points c record the element of the Mandelbrot Set are - almost a type of anti-Buddhabrot .
|
|
|
|
|
Relationship to the logistic equation
The relationship between the Mandelbrot set defined by and the logistic equation is known. The two are related by the quadratic transformation:
The traditional way of showing this relationship is to plot the logistic equation bifurcation diagram and the Mandelbrot set using the transformation between and over a common x-axis and a separate y-axis.
Melinda Green discovered “by accident” that the anti-Buddha bread contained the logistical equation completely. Both representations are based on evaluating traces of non-diverging points that arise from (any) starting point. The iteration functions are related via the transformation given above. It is then easy to see that the anti-Buddha bread for , with and , in the plane produces the bifurcation diagram of the logistic equation if one uses the given transformation. Is selected for rendering . It should be noted that the logistic equation ultimately generates the same trace for all .
Since both the Mandelbrot set and the logistic equation are an integral part of the anti-Buddha bread , one can now show a three-dimensional relationship between the two by using the 3D axes . The animation shows the classic anti-Buddha bread with and , this is the 2D Mandelbrot set in the plane , and the anti-Buddha bread with and , this is the 2D bifurcation diagram of the logistic equation in the plane . We rotate the plane around the axis to first show the plane, then we rotate 90 ° into the plane, followed by a 90 ° rotation to show. An additional rotation of 180 ° results in the same picture, mirrored on the axis. The specially configured anti-Buddha bread , from which the bifurcation diagram of the logistic equation emerges, is a subset of the classic anti-Buddha bread , located in the plane (or ) of the three-dimensional space and perpendicular to the plane . We clarify this by showing that with a 90 ° rotation only the projected plane is "disturbed" , not by the projection of the plane with non-zero.
Individual evidence
- ↑ Melinda Green The Buddha Bread Technique
- ^ A b Daniel Green The deity hiding in the m-set
- ^ The University of Western Ontario's newspaper Chaos (theory) rules for software developers (PDF12MB) , p. 10
- ↑ Alexander Boswell The Buddha Bread
- ↑ Rendering a ridiculously large Buddha bread . July 2, 2010. Retrieved June 1, 2011.


