
Results of the local elections in Neumünster
Election to the 2018 council
Turnout: 35.1%
%
40
30th
20th
10
0
34.0
27.4
16.4
5.9
5.7
4.3
3.9
2.0
0.5
Gains and losses
compared to 2013
% p
4th
2
0
-2
-4
-6
-8th
-2.5
-6.6
+3.9
+1.7
-0.4
+1.3
+2.3
+2.0
-1.6
Remarks:
e Alliance for Citizens
The following lists the results of the local elections in Neumünster . The field of the party that received the most votes or seats in the respective election is marked in color.
Parties and voter initiatives
- B'90 / Greens: Alliance 90 / The Greens
- BfB: Alliance for citizens of Neumünster
- CDU: Christian Democratic Union of Germany
- FDP: Free Democratic Party
- Left: The left
- LKR: Liberal-Conservative Reformers
- NPD: National Democratic Party of Germany
- Pirates: Pirate Party Germany
- SPD: Social Democratic Party of Germany
abbreviation
- Wbt .: turnout
Council assembly elections
Share of votes in percent
| year | Wbt. | CDU | SPD | Green | FDP | BfB | left | NPD | LKR | Pirates |
|---|---|---|---|---|---|---|---|---|---|---|
| 2003 | k. A. | 45.3 | 41.4 | 8.1 | 5.2 | |||||
| 2008 | 41.9 | 34.3 | 33.9 | 8.9 | 9.6 | 13.2 | ||||
| 2013 | 39.8 | 36.5 | 34.0 | 12.5 | 4.2 | 6.1 | 3.0 | 1.6 | 2.1 | |
| 2018 | 35.1 | 34.0 | 27.4 | 16.4 | 5.9 | 5.7 | 4.3 | 3.9 | 2.0 | 0.5 |
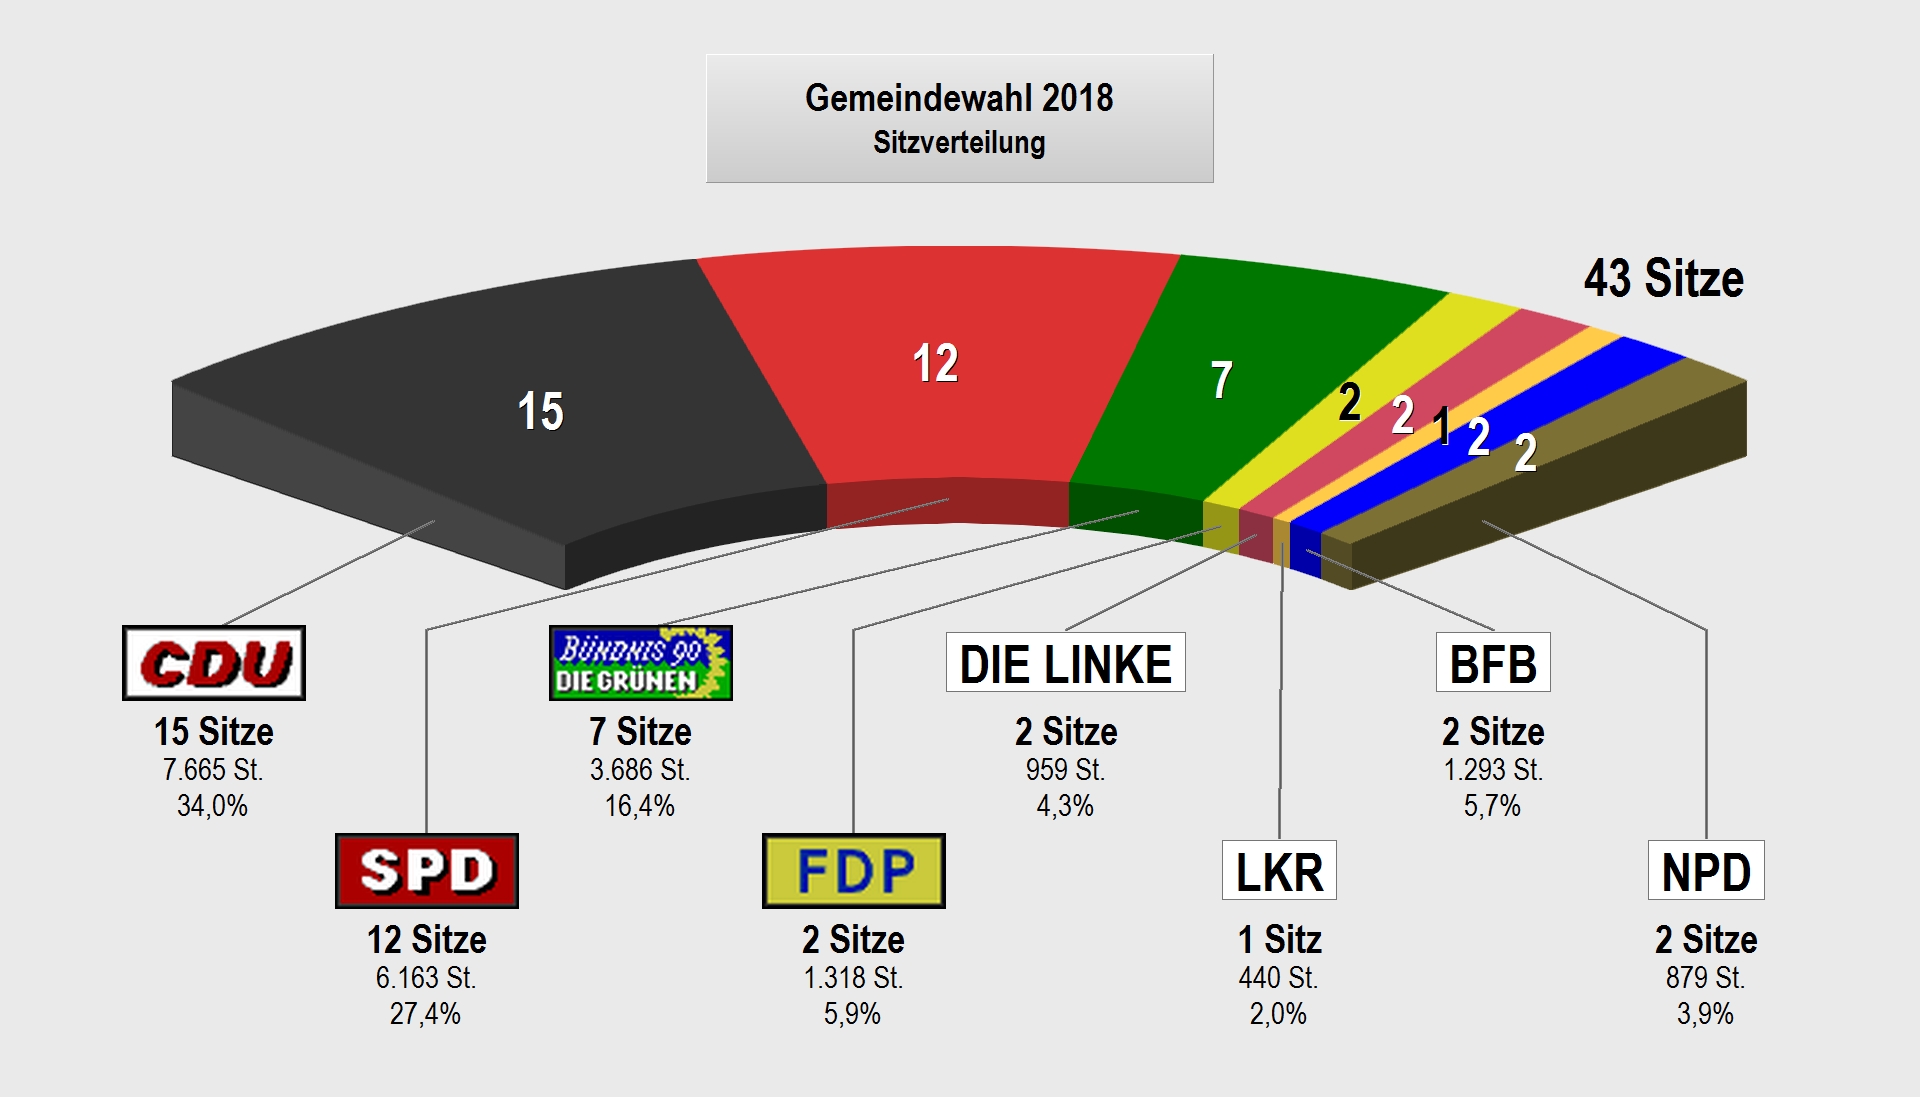
Distribution of seats
| year | total | CDU | SPD | Green | FDP | BfB | left | NPD | LKR | Pirates |
|---|---|---|---|---|---|---|---|---|---|---|
| 2008 | 43 | 15th | 15th | 4th | 4th | 5 | ||||
| 2013 | 43 | 16 | 14th | 5 | 3 | 2 | 1 | 1 | 1 | |
| 2018 | 43 | 15th | 12 | 7th | 2 | 2 | 2 | 2 | 1 |