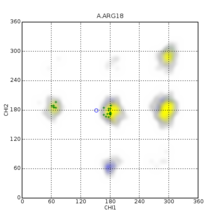
Janin plot
The Janin plot (also Janin diagram ) is a biochemical diagram that shows the statistical distribution of combinations of dihedral angles . While in the Ramachandran plot two dihedral angles (φ and ψ) of a particular protein - the backbone is illustrated, the dihedral angle of are in Janin Plot amino acid side chains ready (χ 1 and χ 2 ). Since not all amino acids have these dihedral angles, some amino acids cannot be shown in the Janin plot. The correlation depends on the various amino acids and the secondary structure of the amino acid sequences . Secondary structures such as α-helices and β-sheets can be identified in the Janin plot .
history
The Janin plot was developed by Joël Janin in 1978.
Individual evidence
- ↑ a b J. Janin, S. Wodak: Conformation of amino acid side-chains in proteins. In: Journal of molecular biology. Volume 125, Number 3, November 1978, pp. 357-386, ISSN 0022-2836 . PMID 731698 .
- ↑ JF Doreleijers, AW Sousa da Silva, E. Krieger, SB Nabuurs, CA Spronk, TJ Stevens, WF Vranken, G. Vriend, GW Vuister: CING: an integrated residue-based structure validation program suite. In: Journal of biomolecular NMR. Volume 54, Number 3, November 2012, pp. 267-283, ISSN 1573-5001 . doi : 10.1007 / s10858-012-9669-7 . PMID 22986687 . PMC 3483101 (free full text).
