Consumer surplus
In economics, consumer surplus is a central component of welfare theory and, together with producer surplus , allows statements to be made about the welfare effect of prices.
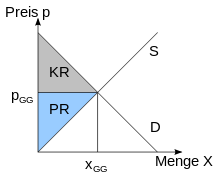
According to Jules Dupuit (1840) and Alfred Marshall (1890), the consumer surplus is the difference between the price that the consumer is willing to pay for a good ( reservation price) and the equilibrium price that the consumer is willing to pay based on the Market conditions actually have to pay ( market price ). The consumer surplus is offset by the producer surplus. Together these form the essential building blocks for determining economic welfare .
Alternative definitions
In other words, it is the difference between the individual appreciation of a good and the market price, or it measures how much individual people are better off overall because they can buy goods on the market.
If the price of € 2 for bread, for which the customer (consumer) is willing to pay € 3, a consumer surplus of € 1 arises.
Examples
Anna likes to eat bread. Even if the bread were more expensive than it actually is, she would still eat it. Probably less, but she wouldn't do without it entirely. One could ask: What is it “worth” to Anna that she can consume bread in the amount she wants? Can this be expressed in euros and cents?
In order to be able to determine the value of consuming bread, one has to compare the situation with bread with the situation without bread. Let us assume that the price of bread is so high that Anna refrains from consuming bread. This is defined as a situation without bread. Now one can ask how Anna would assess the difference between the hypothetical situation without bread and the actual situation with bread in euros and cents. This amount is known as the consumer surplus.
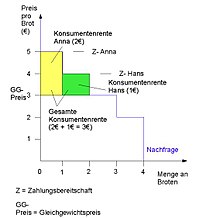
Each individual consumer rates bread consumption differently. In the following diagram we can see the different willingness to pay of individual consumers.
Example: In an online auction, a visitor discovers an object for which he would be willing to pay 100 euros. However, he buys it for 75 euros - the pension for him as a consumer is then 25 euros.
Maximizing the consumer surplus at the expense of the providers can be counteracted by differentiating prices or products in order to skim off the consumer's surplus as much as possible, for example by offering two product variants, each aimed at different customer segments with different willingness to pay.
Example: A cinema offers tickets for students, schoolchildren and professionals at different prices. Here the attempt is made to skim off the generally higher consumer surplus of working people as well as possible.
These considerations also make it clear that, from the customer's point of view , the value of a good must be measured by its willingness to pay, as this reflects the benefit it derives from this good. From the point of view of the provider, however, the value of the goods is measured by the achievable price. Value enhancement strategies of marketing and supply chain management are therefore aimed on the one hand at offering the customer the highest possible benefit and on the other hand designing the offer in such a way that the customer's willingness to pay is exhausted as much as possible (benefit-oriented pricing).
calculation
One can determine the consumer surplus for the individual consumer or for the entire market. The figure below shows the determination of Anna's individual consumer surplus. Anna has a willingness to pay of € 5, but the equilibrium price is only € 4. As a result, she earns a consumer surplus of € 1 (€ 5 - € 4 = € 1). This is indicated in the graphic by the yellow area.
In the following we consider the example under changed conditions. The equilibrium price is now € 3. Anna's consumer surplus increases to € 2 (€ 5 - € 3 = € 2). Hans wins a consumer surplus of € 1 (€ 4 - € 3 = € 1). The yellow rectangle shows Anna's consumer surplus, the green rectangle that of Hans. It is possible to add the consumer surplus of both persons. Anna and Hans together achieve a consumer pension of € 3 (€ 2 + € 1 = € 3).
If all individual consumer surplus is added, one obtains a measure of the aggregated consumer surplus in a market. The blue area in the graphic below represents the aggregated consumer surplus.
This formula applies to the aggregate consumer surplus, with a linear demand curve:
- q: amount
- p_max: reservation price
- p *: equilibrium price
- q *: equilibrium quantity
For this example, the consumer surplus is calculated as follows:
KR = ((€ 6 - € 3) * 30 pieces) / 2 = € 45
It is greatest when there is perfect competition in the market.
The formula for a linear demand curve can no longer be used for more general supply and demand functions, since the area under the demand curve ( ) no longer represents a triangle. In this case, the consumer surplus can be represented as the following integral
- in which
, whereby nothing is asked for the reservation price and the demand is therefore 0.
application
The aggregate consumer surplus can be used to measure the overall benefit that consumers achieve when buying goods in a market.
In connection with the producer surplus , the costs and advantages of alternative market structures , as well as government interventions that change the behavior of consumers and companies in this market, can be assessed.
By adding the aggregated consumer surplus and the aggregated producer surplus, the total welfare of society is obtained; also known as "economic rent".
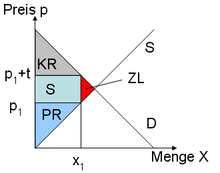
To illustrate this, let's consider the introduction of a consumption tax. This is to be paid by the providers per piece. It is questionable what effects this survey will have on consumer surplus, producer surplus and ultimately on welfare.
The following graphic represents the starting point. The market equilibrium is at the equilibrium quantity q1 and the equilibrium price p1. A natural market equilibrium is Pareto optimal ; In other words, the market is in a state in which no individual can be better off without at the same time making another individual worse off.
Due to the consumption tax, the supply curve is shifting upwards. A new market equilibrium arises at q2 and p2. I.e. the price has gone up and the amount has gone down.
As a result of the tax, both consumer surplus and producer surplus decrease. The consumer surplus falls because the consumers have to pay part of the tax burden (the price has risen) and because the consumers consume less than in the natural equilibrium. The lost pensions are represented by the blue rectangle and the red triangle. The blue rectangle goes to the state as tax revenue, the red triangle is completely lost. It is known as dead-weight-loss or loss of welfare .
literature
- Pindyck, Rubinfeld: Microeconomics . Pearson Studies, 6th Edition, 2005, ISBN 978-3-8273-7164-5
- Krugman, PR, & Obstfeld, M. (2012). International Economy - Theory and Politics of Foreign Trade. Munich, Pearson, ISBN 3-8273-7199-6
- Peter Bofinger: Fundamentals of Economics: An Introduction to the Markets . Pearson Studium, Munich, 2nd edition, 2007, ISBN 3-8273-7222-4
- David Friedmann : The Economic Code. Eichborn 1999, translated from the English by Sebastian Wohlfeil, ISBN 3821808101
Web links
- Consumer and producer surplus (PDF file; 14 kB)


