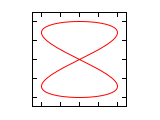
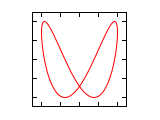
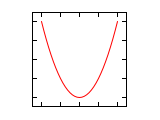
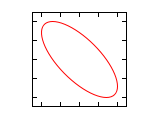
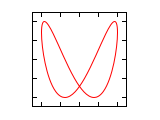
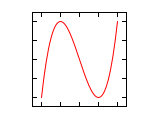
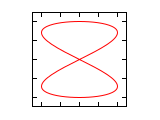
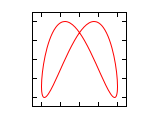
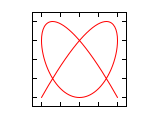
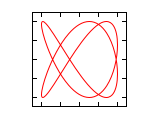
Lissajous figure

Lissajous figures are curve graphs that result from the superposition of two harmonic, mutually perpendicular vibrations of different frequencies. They are named after the French physicist Jules Antoine Lissajous (1822–1880). Later, for example, they played a role in training for a deeper understanding of alternating currents with the help of the oscilloscope .
They are often used for aesthetic purposes. The curve is particularly fascinating when there is a slight deviation between the oscillation frequencies, because the slowly rotating figure creates a 3D impression. Lissajous figures can be represented in a mechanical way with a harmonograph .
Mathematical description
Mathematically, they are parametric graphs of functions of form
Such a function is periodic if and only if the frequency ratio
is rational , i.e. can be converted into an integer fraction. In this case you get a closed figure. Otherwise the curve is not periodic and lies close to the rectangle .
Note: The picture above shows the representation similar to an oscilloscope. There, a lack of coordination of the two oscillations does not lead to a filled rectangle, since, due to the time-limited afterglow of the picture tube, only part of the curve profile is displayed.
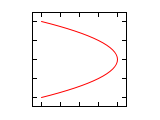
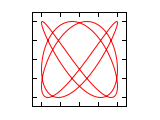
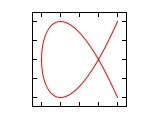
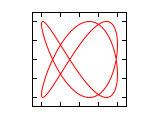
The amplitudes A x and A y only scale the figures horizontally and vertically, respectively. The appearance of the graph depends mainly on the frequency ratio v and the phase φ. If v has the value 1, Δφ = φ 1 - φ 2 results in the phase shift between the oscillations. If v is a rational number not equal to 1, Δφ is usually given for the minimum phase difference. It is also necessary for which vibration the information is given.
The sections figures for frequency ratio 1: n and n: 1 and figures for frequency ratio n 1 : n 2 show Lissajous figures for different frequency ratios and phase differences, the following section Lissajous figures in the oscilloscope and then explains methods for the measurement of the figures.
Figures for frequency ratio 1: n and n: 1 (amplitude ratio 1: 1)
The phase difference Δφ in the following figures always relates to the higher frequency. If the frequency is higher on the horizontal axis, the impression of a rotation around the vertical axis and in the opposite case around the horizontal axis arises if the frequency is not completely adjusted.
| Δφ | 1: 1 | 1: 2 | 1: 3 | 2: 1 | |
|---|---|---|---|---|---|
| 0 | |||||
| ¹ / ₄ · π | |||||
| ¹ / ₂ · π | |||||
| ³ / ₄ · π | |||||
| 1 · π | |||||
| 1¹ / ₄ π | |||||
| 1½ · π | |||||
| 1³ / ₄ · π | |||||
| 2 · π |
Figures for frequency ratio n 1 : n 2 (amplitude ratio 1: 1)
For ratios in which neither the numerator nor the denominator has the value 1, Δφ does not reach the maximum value 2 · π, the repetition of the curve pattern starts earlier. This effect arises because a number of n 1 oscillations of the first signal and n 2 oscillations of the second signal are required to form the figure . Accordingly, more zero crossings need to be taken into account when determining the maximum phase difference.
Lissajous figures in the oscilloscope

When working with the oscilloscope, you get Lissajous figures if you apply a harmonic alternating voltage to both the input for the y and the x deflection with the time deflection switched off .
The shape of the figures allows precise conclusions to be drawn about the frequency and phase position of the two voltages. If the frequencies are the same (e.g. v = 1: 1), the phase difference can be read from the elliptical figure. With two frequencies that are almost the same (or a frequency ratio that is very close to one of the simple rational ratios) the screen of the oscilloscope shows a closed, but time-changing figure. In this way, small frequency differences can be measured with high sensitivity.
This is why Lissajous figures were a common sight in the workshop of television and tube technicians, for example. On the other hand, in their diversity they are particularly (but not only) extremely fascinating to the technical layperson, especially in their slightly animated form. That is why in film art and television monitors in the stage design were often decorated with Lissajous figures when an environment was to appear very modern or futuristic , for example in science fiction films and series.
Sample program
The following program section creates a Lissajous figure with a frequency ratio of and a phase shift of .
This program is located on the openprocessing.org website and can be edited for test purposes.
 1 let horizontalSpeed = 3, verticalSpeed = 4, phasenDifferenzVer = Math.PI/4;
 2 //  Frequenzverhältnis 3:4 -------- Phasenverschiebung pi/4
 3
 4 let angleVer = phasenDifferenzVer, angleHor = 0, oldW, oldH, BoxSize = 150, frame = 0;
 5
 6 function setup(){
 7   BoxSize = (height-100)/2;
 8   oldW = sin(angleHor)*BoxSize+width/2;
 9   oldH = sin(angleVer)*BoxSize+height/2;
10 }
11
12 function draw(){
13   let h = height-(sin(angleVer)*BoxSize+height/2);
14   let w = sin(angleHor)*BoxSize+width/2;
15
16   if(frame>0){
17     line(w, h, oldW, oldH);
18   }
19
20   angleVer += verticalSpeed*0.02;
21   angleHor += horizontalSpeed*0.02;
22   oldW = w;
23   oldH = h;
24
25   frame++;
26 }
See also
Web links
- Three-dimensional Lissajous figures
- Images of Lissajous figures on the digital oscilloscope with 2-channel YT and XY operation
- Lissajous figures to work on yourself
- Simulation of musical intervals, interference, beats, Lissajous curves of two standing waves
- Video: Lissajous railways . Institute for Scientific Film (IWF) 2004, made available by the Technical Information Library (TIB), doi : 10.3203 / IWF / C-14841 .
- Video: Laser + Mirror + Sound
Individual evidence
- ↑ Lissajous Curve by Samimind , at openprocessing.org, accessed July 8, 2019


![[-A_ {x}, A_ {x}] \ times [-A_ {y}, A_ {y}]](https://wikimedia.org/api/rest_v1/media/math/render/svg/8d1fffd61dcb3c4f486ff04aa6000dba1a9096d7)


