
Life table

The mortality table is a table of elimination (number table) that shows how a fictitious collective of people from a certain group of people is expected to decrease through death.
history
Life tables already existed in the early modern period . They go back to John Graunt , who analyzed the death registers in London in 1662 , calculated the first mortality table from this and thus stated for the first time the probability of survival for every age. These data published in his book Natural and Political Observations Made upon the Bills of Mortality (1662).
In 1689 Caspar Neumann had compiled statistical data on the age at death in Breslau , which he sent to Gottfried Wilhelm Leibniz . Neumann's data was used by Edmond Halley as the basis for an article on annuities published in 1693 . Further investigations were carried out by the Dutchman Kerseboom in 1742, the French mathematician Antoine Deparcieux in 1746 and the Swede Pehr Wilhelm Wargentin in 1766 .
In Germany, EW Brune in Berlin (Board of Accounts of the Royal Prussian General Widows Catering Establishment) published mortality tables in 1837, which Carl Friedrich Gauß also used, who dealt with the subject for the widows' fund of the University of Göttingen. Brune evaluated the data of 31,500 married couples from his fund from 1776 to 1834.
Elements of a life table
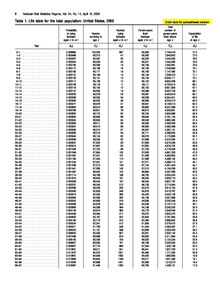
In the life table, the following values are usually listed for the ages up to the final age (usually 100 or higher) , separated by gender :

- the age- and gender-dependent probability of death of the group of people concerned ,
- from this, the number of survivors up to age of a fictitious collective in the person group and is calculated
- the per year of age who died of the fictitious collective.


For each age reached , the probability of survival states the probability with which an individual in the collective will reach old age . The probability of a -year-old person to die before reaching old age , i.e. the probability of death , is thus .


Separate life tables are often used for men and women. The life expectancy of a newborn child and the so-called further life expectancy , i.e. the life expectancy of a person in old age , can be calculated from the life table . In actuarial notation, the age of men is denoted by , that of women by . The mortality of a -year-old man is noted with , that of a -year-old woman with .


In addition to the probabilities of death, the number of people still alive and the number of people dying in old age are tabulated in the life table for each age . One often starts from or newborn people. This can be used to clearly show how a collective of people is reduced in the model by the number of deaths. The following applies:


The final age of the life table is usually by the Greek letter (eg, the DAV 2008 T. , DAV 2004 R: by the age shift the final age of the DAV 2004 R panel, however, can be much larger).


Types of life tables
Period life tables are often used in the insurance industry. Age-specific mortality rates for people living at the same time are determined. Period tables therefore model the mortality ratios of simultaneously living generations within a relatively short observation period.
In contrast to this, cohort mortality tables , which describe the death of a cohort , are unsuitable for calculating pension insurance due to the long observation period.
A generation mortality table is a mortality table in which mortality depends not only on age (and possibly gender), but also on the year of birth. This makes it possible to take into account the increasing life expectancy for people born later. Generation tables are therefore the basis for the calculation of pension insurance. The DAV 1994 R and DAV 2004 R tables already mentioned above are generation tables. Sometimes the year-of-birth dependency is shown in a simplified manner by “making years younger” for the calculation by means of a simple age shift.
In some cases, life tables for insured persons are also used. These take into account that the mortality of the insured collective differs from that of the population e.g. B. deviates due to a health check or self-selection .
The method of calculating the life table belongs to the non-parametric methods of event analysis .
application

If the table is used to calculate premiums for an insurance contract or the actuarial reserve , the first-order probabilities of death are used. They are provided with safety margins vis-à-vis the second-order probabilities (the "realistic" values) in order to carefully assess the risk in each case. They form a suitable basis for calculation . Corresponding mortality tables are published, for example, by the German Actuarial Association (DAV).
- If there is a risk of death of the insured person ( life insurance for death and survival, term life insurance ), the probability of death is increased (surcharge). One example is the DAV 2008 T board .
- If there is a risk of survival ( pension insurance ), the probability of death is reduced (discount). One example is the DAV 2004 R board .
Appropriate DAV tables may be used to calculate the actuarial reserve to be shown in the balance sheet of an insurance company . The DAV 1994 R table does not take into account the trend towards a longer lifespan (due to medical progress and the improvement of living conditions) for people born later, from today's perspective, and may therefore no longer be used by pension schemes.
The mortality tables used for the calculation of retirement pensions ( annuity tables ) take into account the increase in life expectancy. The probability of death to be assumed therefore depends not only on age , but also on the year of birth, since life expectancy has been increasing from year of birth to year of birth for decades. The resulting two-dimensional table with an age shift is also simplified to a one-dimensional table.
See also
Web links
- Germany
- Federal Statistical Office ( Destatis ): Subject area deaths, life expectancy. Accessed on October 12, 2017
- German Actuarial Association (DAV)
- Bavarian life table from 1891/1900 (life expectancy according to completed age)
- Bavarian life table 2009/2011 (life expectancy, survivors, probability of death)
- Austria
- Different countries
Individual evidence
- ^ Meyer's Large Conversational Lexicon . 6th edition. Bibliographisches Institut, Leipzig / Vienna 1909 ( zeno.org [accessed on June 18, 2019] lexicon entry "Mortality").
- ^ Brune: New mortality tables for widow casses. Journal for Pure and Applied Mathematics (Crelle J.), Volume 16, 1837, p. 58, SUB Göttingen
- ↑ GDV: How life tables, life expectancy and pension are related. Retrieved August 12, 2016 .