Power generation in Japan
The power generation in Japan has been in 2018 to 33% of coal, 37% of gas, to 6% of oil, 5% of nuclear power recovered to 8% of water force and 11% of other renewable energy sources.
The tsunami and nuclear catastrophe Fukushima in March 2011, with and after which all nuclear power plants in Japan went offline permanently or temporarily, resulted in a serious change in terms of both generation and consumption . The loss of the production share of 25% was compensated for with gas and, in the medium term, with petroleum products, which were replaced by coal. In 2015 and 2018, some reactors were put back into operation, but the share of electricity production was only around 1%. See Nuclear Power in Japan # After Fukushima
In 2018, an average of 7.480 kWh per person was consumed in Japan, which was 115% compared to the EU15 per capita consumption in 2008 (EU15: 7,409 kWh / person) and 95% compared to the OECD average of 2008 (8,991 kWh / person ).
generation
| year | Terawatt hours |
|---|---|
| 1970 | 359.5 |
| 1980 | 577.5 |
| 1990 | 841.1 |
| 2000 | 1057.9 |
| 2007 | 1180.1 |
| 2008 | 1183.7 |
| 2009 | 1114.0 |
| 2010 | 1156.0 |
| 2011 | 1104.2 |
| 2012 | 1106.9 |
| 2013 | 1087.8 |
| 2014 | 1062.7 |
| 2015 | 1030.1 |
| 2016 | 1042.1 |
| 2017 | 1050.1 |
| 2018 | 1051.6 |
There is no electricity export or import.
Distribution system
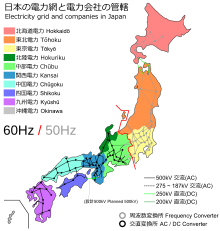
The mains frequency in the eastern part of Japan is 50 Hz , in the western part of Japan 60 Hz. The difference is due to the procurement of generators from Germany by AEG in 1895 for Tokyo, which supply 50 Hz, and from General Electric in the USA in 1896 for Osaka, which supply 60 Hz. The different networks cannot be switched together directly; HVDC close couplings (GKK) are used at the border for electrical energy transmission . A technology similar to that used for high-voltage direct current transmission (HVDC) is used, in contrast to HVDC, but only over a short distance within the converter station . In total, there are four close couplings with a coupling capacity of 300 MW each in operation in the Shin-Shinano Hendensho ( 新 信 濃 変 電 所 ), Sakuma Shūhasū Henkansho ( 佐 久 間 周波 数 変 換 所 ), Minami-Fukumitsu Hendensho ( 電 所 ) 光der ( 電 所 ) 変 der Higashi-Shimizu Frequency Converter in the Higashi-Shimizu Hendensho substation.
At 100 V, Japan has the lowest line voltage (in the lowest network level) worldwide. That implies a higher power loss there than if a higher voltage were to be transmitted, or the need for more transformers.
Individual evidence
- ↑ a b BP: BP Statistical Review of World Energy
- ↑ https://www.indexmundi.com/map/?v=81000&l=de
- ↑ Energy in Sweden, Facts and figures, The Swedish Energy Agency, (in Swedish: Energiläget i siffror), Table: Specific electricity production per inhabitant with breakdown by power source (kWh / person), Source: IEA / OECD 2006 T23 ( Memento of the original from July 4, 2011 in the Internet Archive ) Info: The archive link has been inserted automatically and has not yet been checked. Please check the original and archive link according to the instructions and then remove this notice. , 2007 T25 ( Memento of the original from July 4, 2011 in the Internet Archive ) Info: The archive link was inserted automatically and has not yet been checked. Please check the original and archive link according to the instructions and then remove this notice. , 2008 T26 ( Memento of the original from July 4, 2011 in the Internet Archive ) Info: The archive link was inserted automatically and has not yet been checked. Please check the original and archive link according to the instructions and then remove this notice. , 2009 T25 and 2010 T49 ( Memento from October 16, 2013 in the Internet Archive ).


