Ts diagram
The Ts diagram is an addition to the pv diagram in thermodynamics and in the energy technology in use state diagram illustrating processes. Its abscissa (X-axis) is either the entropy S or - as in the figures - the specific entropy s, its ordinate (Y-axis) the absolute temperature T.
description
The significance of this diagram lies in the fact that the area under the curve corresponds to the heat supplied or removed via the system boundary when there are reversible changes in state . The efficiency of the Carnot process consisting of two isentropes and two isotherms , which is shown as a rectangle in the Ts diagram, can be read directly from the area ratio.
In non- adiabatic irreversible processes, the area corresponds to the sum of the heat and the work dissipated within the system , e.g. B. Friction work (see Fig. 1) . The individual proportions cannot be determined from the Ts diagram alone. To do this, you also need to know the process variables heat and work transferred across the system boundary at all times (the integral value of the work can be obtained, for example, by measuring speed and torque ). In adiabatic processes, e.g. B. in a steam turbine, the area alone represents the dissipated work. If the state curve is known by measuring the state variables (usually pressure and temperature), from which the associated entropy (as the difference to that of the triple point ) can be calculated using the state equations the representation in the Ts diagram gives a good overview of the quality of the process (see adiabatic machine ) .
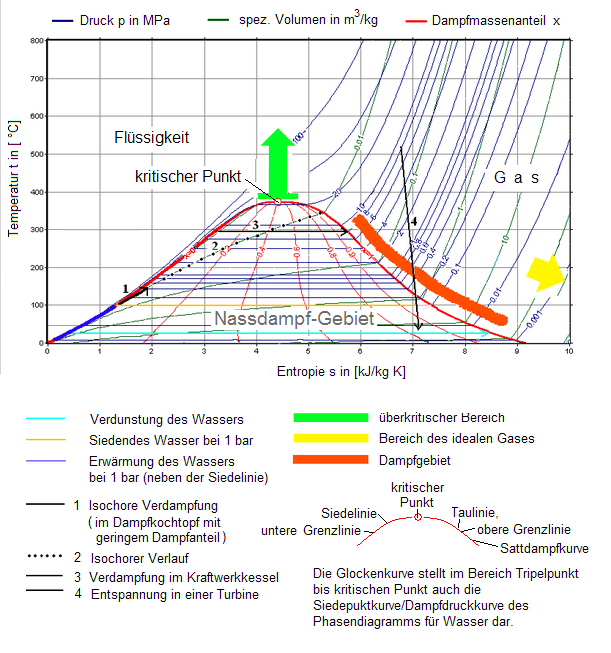
Figure 2 shows the frequently used Ts diagram for water vapor with isobars and isochores and the phase boundary. The ordinate here is the Celsius temperature . Therefore, the chart next to the suitable hs-diagram particularly illustrating the state behavior in the technically important area above the freezing point and to represent the processes in this area, but not to identify the warming and the dissipated work.
See also
literature
Web links
- Presentation ( Memento from September 29, 2007 in the Internet Archive ) (PDF; 3.16 MB) from the Chair of Thermodynamics at the University of the Federal Armed Forces in Munich


