Carpet diagram
The carpet plot is a form of representation that makes it possible to visualize two functions with two independent variables in a two-dimensional representation . In addition to the horizontal X and vertical Y axes, there are two additional axes with the two independent variables that are curved in the drawing area. Up to four values can be read off at the same time and intermediate values can be easily interpolated . In addition, despite the purely two-dimensional form of representation, the impression of a three-dimensional surface is created.
Carpet diagrams are often used in aviation or in turbine design , as various parameters that influence each other must be weighed against each other. A clear visualization can help the designer to make the right decisions.
Another visualization, which is also referred to in the literature as a carpet plot, is the raster diagram .
variants
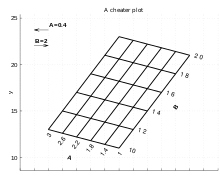
Cheater plots
With the so-called cheater plots, a function with two variables can be visualized in the form of a two-dimensional carpet diagram. In certain cases, this offers better legibility in contrast to the three-dimensional form of representation. Since there are no values for the X-axis in this case, they are calculated using a formula. This can be varied as required for better readability. The X-axis is usually not labeled in cheater plots.
Carpet diagram with contour lines
To accommodate even more information in the carpet diagram , it is also possible to insert a contour diagram . The contour lines are a function of the two independent variables. This can be implemented both in a carpet diagram with four variables and in a cheater plot.
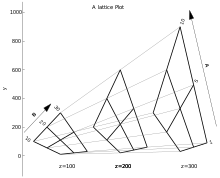
Trellis diagram
If a third axis is to be visualized in addition to the X-axis or the Y-axis, further carpet diagrams can be drawn for discrete values. By connecting the individual intersections , a so-called grid diagram is created. This can be applied to both carpet diagrams and cheater plots. However, with multiple cheater plots, the individual carpet diagrams still have to be shifted in their X-axis.
Individual evidence
- ↑ Aircraft Design & Consulting ( Memento of the original dated November 2, 2013 in the Internet Archive ) Info: The archive link was inserted automatically and not yet checked. Please check the original and archive link according to the instructions and then remove this notice. (PDF; 1.6 MB), accessed on October 22, 2012
- ^ DP Raymer: Aircraft Design: A Conceptual Approach. 2nd ed. Reston: American Institute of Aeronautics, 1992, p. 529
- ↑ a b Gasturb Tutorial 2 - Cycle Design Parametric Study ( MS PowerPoint ; 6.0 MB), accessed on October 22, 2012
- ^ 'Whole building electrical power over time' . Archived from the original on May 13, 2009. Info: The archive link was inserted automatically and has not yet been checked. Please check the original and archive link according to the instructions and then remove this notice. Retrieved December 17, 2008.
- ↑ The Generation of Carpet Plots (PDF; 199 kB), Sidney A. Powers, accessed on October 22, 2012
- ↑ ESDU 04008 Use of Carpet Plots to represent functions of two variables ESDU International plc, November 2004, p. 14
literature
- IHS ESDU, "ESDU 04008 Use of Carpet Plots to represent functions of two variables." ESDU International plc, November 2004
- IHS ESDU, "ESDU 04012 Examples of construction of carpet plots from experimental data". ESDU International plc, March 2004


