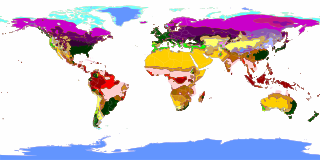
Effective climate classification according to Köppen and Geiger
A rainy climate is a climate in which relatively high rainfall occurs all year round.
General climate typing The term "rain climate" is based on the Köppen / Geiger classification , which in today's climatic geography belongs to the standard of climate classification in addition to the Troll / Paffen climate classification .
Köppen / Geiger differentiate between five different climatic zones:
Within climate zone A, Köppen / Geiger differentiate between two types of climate:
Features of the rainy climate The rainy climate is characterized as a humid climate with year-round precipitation and, on average, year-round positive climatic water balance (precipitation> evaporation), in which most of the precipitation falls as rain. The mean temperature in the tropical rainy climate remains above 18 ° C in all months.
A special feature of the rainy climate is the cloud forest climate (Spanish also: Yunga climate), in which the plants are mainly supplied with water from the fog and thus from the air.
Examples
Kuching (Malaysia) Climate diagram
Monthly average temperatures and rainfall for Kuching, Malaysia
Jan
Feb
Mar
Apr
May
Jun
Jul
Aug
Sep
Oct
Nov
Dec
Max. Temperature ( ° C )
29.8
30.2
31.3
32.3
32.7
32.7
32.4
32.4
32.0
31.9
31.6
30.6
O
31.7
Min. Temperature (° C)
22.9
23.0
23.2
23.4
23.6
23.3
23.0
23.0
22.9
22.9
22.9
22.9
O
23.1
Precipitation ( mm )
684.1
473.3
338.6
272.9
241.8
220.3
185.6
229.6
262.3
338.6
371.5
498.1
Σ
4,116.7
Hours of sunshine ( h / d )
3.9
4.4
5.0
5.5
5.9
6.1
5.7
5.4
4.8
4.7
4.5
4.4
O
5
Rainy days ( d )
22nd
17th
16
17th
15th
14th
13
14th
16
19th
22nd
22nd
Σ
207
Water temperature (° C)
27
27
28
29
29
29
28
28
28
28
28
28
O
28.1
Humidity ( % )
89
88
86
86
86
84
83
83
85
86
88
89
O
86.1
T
Jan
Feb
Mar
Apr
May
Jun
Jul
Aug
Sep
Oct
Nov
Dec
N
684.1
473.3
338.6
272.9
241.8
220.3
185.6
229.6
262.3
338.6
371.5
498.1
Jan
Feb
Mar
Apr
May
Jun
Jul
Aug
Sep
Oct
Nov
Dec
Ratnapura (Sri Lanka) Climate diagram
Monthly average temperatures and rainfall for Ratnapura, Sri Lanka
Jan
Feb
Mar
Apr
May
Jun
Jul
Aug
Sep
Oct
Nov
Dec
Max. Temperature ( ° C )
32.7
33.8
34.0
33.5
32.0
31.0
30.7
30.7
30.9
31.3
31.7
31.8
O
32
Min. Temperature (° C)
21.7
21.8
22.6
23.4
23.9
23.7
23.5
23.4
23.1
22.9
22.6
22.3
O
22.9
Precipitation ( mm )
111.1
137.0
212.2
338.9
475.9
412.2
292.8
304.1
421.4
436.8
371.4
235.3
Σ
3,749.1
Rainy days ( d )
9
9
14th
20th
20th
21st
19th
20th
20th
21st
18th
14th
Σ
205
T
Jan
Feb
Mar
Apr
May
Jun
Jul
Aug
Sep
Oct
Nov
Dec
N
111.1
137.0
212.2
338.9
475.9
412.2
292.8
304.1
421.4
436.8
371.4
235.3
Jan
Feb
Mar
Apr
May
Jun
Jul
Aug
Sep
Oct
Nov
Dec
Manaus (Brazil) Climate diagram
Monthly average temperatures and rainfall for Manaus, Brazil
Jan
Feb
Mar
Apr
May
Jun
Jul
Aug
Sep
Oct
Nov
Dec
Max. Temperature ( ° C )
30.5
30.4
30.6
30.7
30.8
31
31.3
32.6
32.9
32.8
32.1
31.3
O
31.4
Min. Temperature (° C)
23.1
23.1
23.2
23.3
23.3
23
22.7
23
23.5
23.7
23.7
23.5
O
23.3
Precipitation ( mm )
260.1
288.3
313.5
300.1
256.3
113.6
87.5
57.9
83.3
125.7
183
216.9
Σ
2,286.2
Hours of sunshine ( h / d )
3.7
3.1
3.2
3.7
4.8
6.2
6.9
7.3
6.5
5.5
4.7
4.2
O
5
Rainy days ( d )
21st
20th
21st
20th
19th
12
10
7th
9
11
12
18th
Σ
180
Humidity ( % )
86
87
88
87
87
83
80
77
77
79
81
85
O
83.1
T
Jan
Feb
Mar
Apr
May
Jun
Jul
Aug
Sep
Oct
Nov
Dec
N
260.1
288.3
313.5
300.1
256.3
113.6
87.5
57.9
83.3
125.7
183
216.9
Jan
Feb
Mar
Apr
May
Jun
Jul
Aug
Sep
Oct
Nov
Dec
Individual evidence
↑ McKnight, Tom L; Hess, Darrel: Climate Zones and Types: The Köppen System . In: Physical Geography: A Landscape Appreciation . Prentice Hall, Upper Saddle River, NJ 2000, ISBN 0-13-020263-0 , pp. 205-211.
^ DIERCKE Dictionary General Geography, Munich 1997, page 689
↑ Klimadiagramme.de
↑ GeoDZ.com
<img src="https://de.wikipedia.org//de.wikipedia.org/wiki/Special:CentralAutoLogin/start?type=1x1" alt="" title="" width="1" height="1" style="border: none; position: absolute;">
