k-means algorithm
A k -means algorithm is a method for vector quantization that is also used for cluster analysis . A previously known number of k groups is formed from a set of similar objects . The algorithm is one of the most widely used techniques for grouping objects because it quickly finds the centers of the clusters. The algorithm prefers groups with low variance and similar size.
The algorithm is very similar to the EM algorithm and is characterized by its simplicity. Extensions are the k-median algorithm and the k-means ++ algorithm .
Historical development
The term "k-means" was first used by MacQueen in 1967, but the idea goes back to Hugo Steinhaus in 1957. The standard algorithm, nowadays usually referred to as the "k-means algorithm", was proposed by Lloyd for pulse code modulation in 1957 , but was only published in a computer science journal in 1982 and largely corresponds to Forgy's method, which was published in 1965 . Another variant is that of Hartigan and Wong, which avoids unnecessary distance calculations by also using the distance to the second nearest center point. A precise assignment of the algorithms is often made wrong: In particular, the algorithm is often described by Lloyd / Forgy, but MacQueen is named as the source.
Problem
The aim of k- means is to divide the data set into k partitions in such a way that the sum of the squared deviations from the cluster centroids is minimal. Mathematically, this corresponds to the optimization of the function
with the data points and the focal points of the clusters . This objective function is based on the least squares method and one also speaks of clustering by minimizing the variance, since the sum of the variances of the clusters is minimized. Since is also the squared Euclidean distance , k -Means effectively assigns each object to the closest (according to Euclidean distance) cluster centroid. Conversely, the arithmetic mean is a least squares estimator , so it also optimizes this criterion.
Algorithms
Since the search for the optimal solution is difficult ( NP-difficult ), an approximate algorithm is normally used, such as the heuristics of Lloyd or MacQueen. Since the problem is dependent on k , this parameter must be specified by the user. However, there are also approaches to select this parameter by using a second object (cf. X-Means, Akaike information criterion , Bayesian information criterion and silhouette coefficient ).
Lloyd algorithm
The most common k -means algorithm used is the Lloyd algorithm, often referred to as "the k -means algorithm", although Lloyd did not use that name. Lloyd's algorithm consists of three steps:
- Initialization: Choose random mean values : from the data set.
-
Assignment: Each data object is assigned to the cluster in which the cluster variance is increased the least.
-
Update: Recalculate the centers of the clusters:
Steps 2–3 are repeated until the assignments no longer change.
MacQueen's algorithm
MacQueen introduced another algorithm called " k -Means":
- Choose the first k elements as cluster centers
- Assign each new element to the cluster that has the least increase in variance and update the cluster center
While it was originally - presumably - not intended, this algorithm can also be iterated to get a better result.
Variations
- k-Means ++ tries to find better starting points.
- The filtering algorithm uses a kd tree as the data structure .
- The k-means algorithm can be accelerated taking into account the triangle inequality .
- Bisecting k-means starts with , and then always divides the largest cluster until the desired k is reached.
- X-means starts with and increases k until a secondary criterion (Akaike information criterion or Bayesian information criterion) does not improve any further.
requirements
k -Means optimizes the squared deviations from a mean. It can therefore only be used with numeric attributes for which a meaningful mean can be calculated. Categorical attributes (for example "car", "truck", "bicycle") cannot be used because no mean value can be calculated here.
The parameter k , the number of clusters, must be known in advance. However, it can also be determined experimentally. The problem is that the different clusters have to be compared with one another and the cost function decreases monotonically with increasing k . One solution is the silhouette coefficient , which provides an evaluation of clusters independent of k . This not only checks how far a point is from one's own cluster focus, but also the distances from other cluster focuses are included in the evaluation of the clustering.
The clusters in the data set must be roughly the same size, since the algorithm always partitions the data set in the middle between two cluster centers.
The data set must not contain a lot of noise or not many outliers . Incorrect data objects often shift the computed cluster centers considerably, and the algorithm has no precautions against such effects (cf. DBSCAN , which explicitly provides for "noise" objects).
Problems

k -Means is a powerful algorithm, but not without weaknesses. A k -means algorithm does not have to find the best possible solution. The solution found depends heavily on the chosen starting points. The simplest approach is to start the algorithm several times in a row with different starting values and to take the best solution. However, there are also many considerations as to how a suitable distribution of the starting values can be achieved. These include k-means ++, but the cluster centers can also be approximated before k-means starts by taking small samples. It also makes a difference whether you choose any cluster centers or assign each point to any cluster and then determine the cluster centers.
Another disadvantage is that the number of cluster centers k is selected in advance. The use of an unsuitable k can result in completely different, possibly unintuitive solutions. With a "wrong" k , good clustering cannot occur. The solution is to try different values for k and then choose a suitable one, for example using the silhouette coefficient or by comparing the different clustering costs.
Groups in the data can, as in the iris example shown, overlap and blend seamlessly into one another. In such a case, k -Means cannot reliably separate these groups because the data does not follow the cluster model used.
Furthermore, k -Means always looks for convex clusters (due to the minimization of the distance to the cluster's center of gravity). Other algorithms such as DBSCAN can also find “density-based” clusters of any shape. What is also not supported by k -Means are hierarchical clusters (i.e. clusters that in turn have a cluster structure), as can be found with OPTICS , for example.
Finally, in k-means, each point is assigned to a cluster, there is no way to identify outliers. These can strongly falsify the result. A previous noise reduction or other algorithms, such as DBSCAN , which automatically detect noise can help .
Extensions
K median
In the k-median algorithm, the Manhattan distance is used in the assignment step instead of the Euclidean distance . In the update step, the median is used instead of the mean .
K-Means ++
The k-Means ++ algorithm does not select the cluster focal points randomly, but according to the following rule:
- As the first cluster focus, randomly select an object
- For each object calculate the distance to the closest cluster centroid
- Randomly choose an object as the next cluster focus. The probability that an object will be selected is proportional to , i. H. the further the object is from the already selected cluster centroids, the more likely it is that it will be selected.
- Repeat steps 2 and 3 until cluster focal points are determined
- Now run the usual k-means algorithm
Usually the following k-means algorithm converges in a few steps. The results are as good as with a standard k-means algorithm, but the algorithm is typically almost twice as fast as the k-means algorithm.
K-Medoids (PAM)
The PAM algorithm (Partitioning Around Medoids, Kaufman and Rousseeuw, 1990) - also known as k-medoids - can be interpreted as a variant of the k-means algorithm that converges with any distance.
- Select objects as cluster focal points (medoid)
- Assign each object to the closest cluster focus
- Swap roles for each cluster focus and each non-cluster focus
- For each swap, calculate the sum of the distances or dissimilarities
- As the new cluster focus, choose the swap that delivers the smallest sum
- Repeat 2-5. until the cluster focus no longer changes
In the original version of PAM, the first step - the choice of the initial medoids - makes up a large part of the algorithm. Since only the best swap is carried out in each iteration, the algorithm is almost deterministic (except for exactly the same distances). As a result, the algorithm is usually very slow.
While k-means minimizes the sum of the variances, k-medoids minimizes the distances. In particular, this algorithm can be used with any distance functions and is still guaranteed to converge.
example
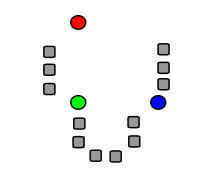
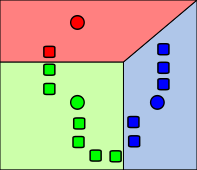
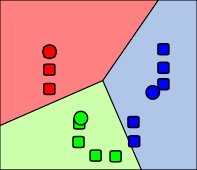
The following figures show an example of a run of a k -means algorithm to determine three groups:
Application in image processing
In the image processing which is k -Means algorithm often used for segmentation used. The Euclidean distance is often not a sufficient measure of distance and other distance functions based on pixel intensities and pixel coordinates can be used. The results are used to separate the foreground and background and to recognize objects. The algorithm is widely used and implemented in popular image processing libraries such as OpenCV , Scikit-image and itk .
software
K-means and its variants are available in various open source software.
- Dlib
- ELKI contains the variants of Lloyd and MacQueen, plus different strategies for the starting values such as k-means ++, and variants of the algorithm such as k-medians, k-medoids and PAM.
- GNU R contains the variants of Hartigan, Lloyd and MacQueen, and additional variations in the “flexclust” expansion package.
- OpenCV contains a version of k-means optimized for image processing (including k-means ++ seeding)
- Scikit-learn contains k-means, including Elkan's variant and k-means ++.
- Weka contains k-means (including k-means ++ seeding) and the extension x-means.
literature
- David MacKay: Information Theory, Inference and Learning Algorithms . Cambridge University Press, 2003, ISBN 0-521-64298-1 , Chapter 20. An Example Inference Task: Clustering, pp. 284-292 ( inference.phy.cam.ac.uk inference.phy.cam.ac.uk (PDF)).
- Gary Bradski, Adrian Kaehler: Learning OpenCV Computer Vision with the OpenCV Library . O'Reilly, 2001, ISBN 978-0-596-51613-0 .
Individual evidence
- ↑ Gary Bradski, Adrian Kaehler: Learning OpenCV computer vision with the OpenCV library . O'Reilly, 2001, ISBN 978-0-596-51613-0 , pp. 479-480 .
- ^ JB MacQueen: Some Methods for Classification and Analysis of Multivariate Observations . In: Proceedings of 5th Berkeley Symposium on Mathematical Statistics and Probability . tape 1 . University of California Press, 1967, pp. 281-297 ( projecteuclid.org [accessed April 7, 2009]).
- ^ Hugo Steinhaus : Sur la division des corps matériels en parties . In: Bull. Acad. Polon. Sci. 12th edition. tape 4 , 1957, pp. 801-804 (French).
-
^
SP Lloyd: Least square quantization in PCM . In: Bell Telephone Laboratories Paper . 1957. , later in a magazine:
SP Lloyd: Least squares quantization in PCM . In: IEEE Transactions on Information Theory . 2nd Edition. tape 28 , 1982, pp. 129–137 , doi : 10.1109 / TIT.1982.1056489 ( cs.toronto.edu (PDF; 1.3 MB) [accessed April 15, 2009]). - ^ EW Forgy: Cluster analysis of multivariate data: efficiency versus interpretability of classifications . In: Biometrics . 21st edition. 1965, p. 768-769 .
- ^ JA Hartigan: Clustering algorithms . John Wiley & Sons, 1975.
- ↑ JA Hartigan, MA Wong: Algorithm AS 136: A K-Means Clustering Algorithm . In: Journal of the Royal Statistical Society, Series C (Applied Statistics) . 1st edition. tape 28 , 1979, pp. 100-108 , JSTOR : 2346830 .
- ↑ Martin Ester, Jörg Sander: Knowledge Discovery in Databases: Techniques and Applications . Springer, Berlin 2000, ISBN 3-540-67328-8 .
- ↑ David Arthur, Sergei Vassilvitskii: K-means ++: The Advantages of Careful seeding . In: Proceedings of the Eighteenth Annual ACM-SIAM Symposium on Discrete Algorithms . Society for Industrial and Applied Mathematics, Philadelphia, PA, USA 2007, ISBN 978-0-89871-624-5 , pp. 1027-1035 ( PDF [accessed March 27, 2015]).
- ↑ T. Kanungo, DM Mount, NS Netanyahu, CD Piatko, R. Silverman, AY Wu: An efficient k-means clustering algorithm: Analysis and implementation . In: IEEE Trans. Pattern Analysis and Machine Intelligence . 24, 2002, pp. 881-892. doi : 10.1109 / TPAMI.2002.1017616 . Retrieved April 24, 2009.
- ^ C. Elkan: Using the triangle inequality to accelerate k-means . In: Proceedings of the Twentieth International Conference on Machine Learning (ICML) . 2003 ( ucsd.edu (PDF; 88 kB)).
- ↑ AK Jain, RC Dube: Algorithms for Clustering Data , Prentice-Hall., 1981
- ^ PS Bradley, OL Mangasarian, WN Street: Clustering via Concave Minimization. In: MC Mozer, MI Jordan, T. Petsche (Eds.): Advances in Neural Information Processing Systems , vol. 9, MIT Press, Cambridge MA 1997, pp. 368-374.
- ↑ T. Kanungo, D. Mount, N. Netanyahux, C. Piatko, R. Silverman, A. Wu A Local Search Approximation Algorithm for k -Means Clustering . (PDF; 174 kB) In: Computational Geometry: Theory and Applications , 2004.
- ^ S. Vinod: Integer programming and the theory of grouping . In: Journal of the American Statistical Association . tape 64 , 1969, p. 506-517 .
- ↑ Module: segmentation - skimage docs. Retrieved September 8, 2018 .
- ↑ dlib C ++ Library - kkmeans_ex.cpp. Retrieved January 8, 2019 .


