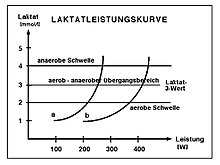
Lactate performance curve
A lactate performance curve (abbreviated LLK - exercise load-lactate relationship ) shows the relationship between performance and lactate concentration in arterial blood.

Interpretation of the curves
Lactate performance curves are determined as part of performance diagnostics (in the laboratory with ergometric methods or in the field test ), preferably in the endurance disciplines, but also in the clinical context of exercise medicine and are used to control stress and determine endurance performance . Set in competitive sports is a much-used test to the current capacity to identify and control training loads in endurance.
Shifts to the right of the curve progression characteristic of the step test mean an improvement in endurance performance in longitudinal studies.
In untrained people there is an increasingly steep rise in the lactate concentration in the blood from approx. 50%, in top-class endurance athletes at approx. 90% of the maximum oxygen uptake . The maximum lactate concentration in the blood is generally only reached a few minutes after the end of the exercise, depending on the maximum exercise intensity achieved.
When interpreting lactate performance curves, some secondary factors must be taken into account. The practical use and the physiological background of the so-called anaerobic threshold (from the increase in the lactate concentration) is controversial (see Anaerobic threshold ). In contrast, there is currently no more precise and, at the same time, simpler method for determining real endurance performance than the interpretation of lactate performance curves.
literature
- W. Hollmann (Ed.): Sports medicine. JA Barth Verlag, Heidelberg / Leipzig 1995, ISBN 3-335-00411-6 .
- R. Rost (ed.): Textbook of sports medicine. German Ärzteverlag, Cologne 2001, ISBN 3-7691-7073-3 .
- K. Röcker: Dispute about the emperor's beard: Which lactate threshold is the best? In: German magazine for sports medicine. 59, No. 12, 2008. (PDF; 2.2 MB)