
Multivariate method
By means of multivariate methods (also: Multivariate analysis ) are in the multivariate statistical multiple Statistical variable or random variables at the same time examined. For example, the variables number of seats , weight , length , etc. can be recorded for vehicles . In the univariate analysis, however, each variable is analyzed individually.
Relationship or dependency structures between the variables, e.g. B. a larger number of seats results in a greater weight, can only be recognized with a multivariate, but not with a univariate analysis.
structure
Multivariate methods essentially want to reduce the number of variables and / or observations contained in a data set without significantly reducing the information contained therein. For this purpose, the (context) structure of the data is analyzed. Either you specify a structure and check whether the data fit together with the given structure ( structure- checking procedure : part of inductive statistics ), or you try to extract the structure from the data ( structure-discovering procedure : part of exploratory statistics ).
The classic methods are all linear models that place special demands on the data used. The data should be free of outliers and not distributed asymmetrically . If the data deviates from the required structure, one remedy is, for example, by removing existing outliers or subjecting the data to a nonlinear transformation, such as taking the logarithm .
There are alternative methods that enable iteratively obtained solutions. Frequently used criteria for optimal solutions are
- Distances between points in a multidimensional space. The Mahalanobis distance is particularly worth mentioning here .
- Variances that are minimized or maximized. In information theory, the variance serves as a measure of the information content of data.
The manual calculation of multivariate methods is usually very time-consuming. Therefore, these methods only experienced their boom with the development of EDP .
The results often do not allow any conclusions to be drawn about the underlying data. For example, only a few details can be given about the underlying probability distributions for results .
Structure discovery processes
Structure discovery methods are e.g. B.
- the factor analysis , principal component analysis and correspondence analysis to reduce many variables to a few latent constructs
- the cluster analysis to reduce many observations to a few groups of observations and
- the multidimensional scaling for the calculation of low-dimensional configurations from distances or (in) similarities between observations.
Structural testing procedures
| Examples of structure testing procedures | ||
|---|---|---|
| Scale level of | independent variables | |
| dependent variable | Metric | Categorically |
| Metric | Multiple linear regression | Analysis of variance , dummy variables -Regression |
| Categorically | Discriminant analysis , logistic regression | Log-linear model |
As part of the regression analysis for a dependent variable and multiple independent variables, generalized linear models are used to account for the scale levels of the dependent and independent variables. These include B. the multiple linear regression, the logistic regression (logit model) and the log-linear models etc.
Further structure checking procedures are
- the analysis of variance , which actually tests mean differences between different groups,
- the Confirmatory factor analysis , the given summaries of many variables to a few latent constructs checks
- the structural equation models, which also allow regression models between latent constructs,
- the Artificial Neural Networks ,
- the discriminant analysis and
- the conjoint analysis .
Graphic representation

A number of special graphic representations have been developed to represent several variables. One of the most famous early multivariate graphics is Charles Joseph Minard's 1869 map of Napoleon's Russian campaign.
Human beings cannot see more than three dimensions; usually only two dimensions on a screen. High-dimensional data can therefore often not be represented without loss of information.
Special display methods are:
- 3D scatter plot
- Scatterplot matrix ( English scatter plot matrix )
- Chernoff or Flury faces
- Andrews curves
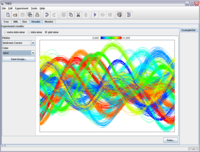
- Parallel coordinates
- Radar diagram
- Grand Tour

3D scatter plot

Scatterplot matrix of the iris data

Parallel coordinates plot of the flea beetle data

Chernoff or Flury faces. The facial features represent the national records in various running disciplines. Each face corresponds to a country.
Andrews curves
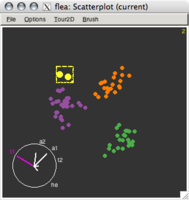
Grand Tour of the Flea Beetle Dates

Radar diagram


Examples
Examples of using multivariate methods:
- To create psychological profiles and use comparisons to find out who is the most likely perpetrator / speaker / author ( criminology , linguistics ).
- To compare the text of an anonymous author with texts by known authors and to find the most likely author (a variation of the first point mentioned).
- Data mining : Large amounts of data in databases are analyzed for unknown structures. One hopes to gain knowledge about the interaction of different aspects, for example consumer spending depending on social status by finding out similarity structures.
- Development of social coordination processes (political sociology) and the influence of individual actors on it.
- Debtor credit checks (discriminant analysis).
- When analyzing securities : Which company figures mainly influence a company's profitability ? (Factor analysis)
- When looking for causes for the ice ages (factor analysis)
- In radio astronomy for signal analysis at SETI .
- The indirect hard modeling method is suitable for the analysis of peak-shaped data .
literature
- H. Ahrens, Jürgen Läuter : Multi-dimensional analysis of variance . Akademie-Verlag, Berlin 1974.
- P. Atteslander, J. Cromm, B. Grabow: Methods of empirical social research. 11th edition. Gruyter-Verlag , 2006, ISBN 3-503-09740-6 . (Basic knowledge)
- Klaus Backhaus , B. Erichson, R. Plinke: Multivariate Analysis Methods. An application-oriented introduction. 11th edition. Springer, Berlin 2006, ISBN 3-540-27870-2 .
- APM Coxon, PM Davies: The User's Guide to Multidimensional Scaling. Heinemann Educational Books, London 1982, ISBN 0-435-82251-9 and ISBN 0-435-82252-7 .
- F. Daly et al. a .: Elements of Statistics . FT Prentice Hall, Harlow 1994, ISBN 0-201-42278-6 .
- L. Fahrmeir, G. Tutz: Multivariate Statistical Modeling Based on Generalized Linear Models . 2nd Edition. Springer, New York 2001, ISBN 0-387-95187-3 .
- A. Handl, T. Kuhlenkasper: Multivariate Analysis Methods. Theory and Practice with R. 3rd edition. Springer, Berlin 2017, ISBN 978-3-662-54753-3 .
- WJ Krzanowski: Principles of Multivariate Analysis. Oxford University Press, 2000.
- KV Mardia, JT Kent, JM Bibby: Multivariate Analysis . (= Probability and Mathematical Statistics). Elsevier, 2006, ISBN 0-12-471252-5 .
- B. Tabachnick, L. Fidell: Using Multivariate Statistics. 5th edition. Allyn & Bacon, Boston 2006, ISBN 0-205-45938-2 .
Web links
- Irene Rößler, Albrecht Ungerer: Collection of formulas for the multivariate method (PDF; 1.86 MB)
- Data Science Textbook . TIBCO Software Inc., 2020 (English) - very extensive presentation of the most important multivariate analysis methods
Individual evidence
- ↑ Student work at the HU Berlin
- ↑ KLT-optimized telecomunications. In: Claudio Maccone: Deep space flight and communications . Springer, Berlin 2009, ISBN 978-3-540-72942-6 , pp. 149-248; Innovative SETI by the KLT (PDF) accessed on July 7, 2010