Pole-zero diagram
The pole-zero diagram , or PN diagram for short , represents the poles and zeros of the transfer function of a system in the complex number plane . The system can be an electrical system, e.g. B. a filter , but it can also be a mechanical system to be controlled, e.g. B. a vehicle with a vehicle dynamics control. Pole-zero diagrams are most frequently used in communications engineering and control engineering .
From a pole-zero diagram , conclusions can be drawn about the magnitude and phase curve of the frequency response of a system, as well as its impulse and step response. It thus forms a valuable basis for analysis , synthesis and considerations of stability of circuits , filters and other transmission systems.
The creation and use of a pole-zero diagram requires appropriate knowledge of mathematics and systems theory . The transfer function, the poles and zeros of which are shown, is the Laplace transform of the impulse response or the z transform of a system. The representation takes place in a complex number plane . Usually single poles are marked with a cross, multiple poles with a double cross and zero positions with a small circle. The creation of pole-zero diagrams or the derivation of transfer functions or other system properties from pole-zero diagrams is now often supported in practice by software.
Meaning of the pole and zero positions
From the position of the poles one can see, among other things, whether a system is causal and stable . Poles determine the time behavior of the system. The system is stable when all poles of the transfer function lie in the open left half-plane (LHE) of the diagram. If a pole has a real part of 0, the system is borderline stable . Realizable (causal) systems have at least as many poles as zeros. The frequency transmission properties can be estimated from the distance between all poles and zeros to a frequency in the diagram. Natural oscillation processes are shown by two complex conjugate poles. Complex poles in the open left half-plane indicate decaying vibrations. All of these clear diagram interpretations and many other interpretations of this kind can be obtained with the systems theory of communications engineering.
One moves on the frequency axis of by , as each pole rotates in the LHE, and each zero in the right half plane (RHE) to the phase . Each zero in the LHE causes a phase shift by .
example
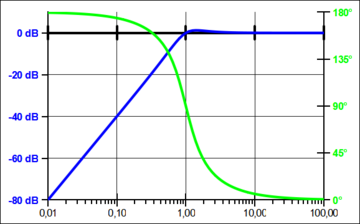
The system function, the pole-zero diagram and the Bode diagram for a second-order high-pass filter are given below:
| Transfer function | PN scheme | Bode diagram |
|
|

|

|
As can be seen, a 2nd order high-pass filter has a complex conjugate pole pair and a double zero in the origin of the coordinates. The system is therefore stable.
Minimum-phase systems have no zero and pole points in the RHE.
literature
- Otto Föllinger, Mathias Kluwe: Laplace, Fourier and z transformation . 10th edition. VDE Verlag, Berlin 2011, ISBN 978-3-8007-3257-9 .
- Dieter Kreß, Benno Kaufhold: Understanding and deepening signals and systems. 1st edition. Vieweg + Teubner Verlag, Wiesbaden 2010, ISBN 978-3-8348-1019-9 .
- James G. Holbrook: Laplace Transform . Textbook for electrical engineers and physicists, 2nd edition, Springer Fachmedien, Wiesbaden 1973, ISBN 3-663-01883-0 .
- Thomas Frey, Martin Bossert: Signal and System Theory. 1st edition. BG Teubner Verlag, Stuttgart 2004, ISBN 3-519-06193-7 .


