Radio occultation
Radio occultation , also known as the occultation method, is a measurement technique for probing planetary atmospheres using phase-correct radio signals that propagate through the atmosphere from a transmitter to a receiver. Both the transmitter and the receiver are located outside the atmosphere to be probed during the measurement phase.
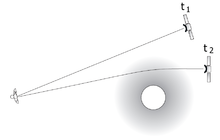
Carrying out the measurement requires a special geometry of the space probe to the receiving station, whereby the space probe disappears behind the planet from the point of view of the receiver during the measurement and thus goes into occultation .
As the radio beam travels from space above the atmosphere to a point in the atmosphere, the observation data is continuously recorded. The probed medium has a characteristic effect on the radio signal and changes its phase angle , amplitude and polarization .
The influence of the signal by the medium generates a time-dependent data set that corresponds to the height profile of the refractive index . For gas mixtures, this profile of the neutral atmosphere is proportional to the density, from which height profiles of pressure and temperature of the neutral atmosphere can be calculated using the basic hydrostatic equation and the ideal gas law . From the proportionality of the electron density to the height profile of the refractive index, additional statements about the electron density of the ionosphere are possible.
history
The idea of stellar occultation for exploring planetary atmospheres, as it was first published in 1904 by Anton Pannekoek in the "Astronomical News", served in 1962 by VR Eshleman of Stanford University in California as a template for the radio occultation experiment.
At the same time, DL Cain and colleagues from JPL developed error analyzes for satellite navigation with the then new maser-controlled antenna systems. The main focus of the analysis was on error contributions from the earth's atmosphere and ionosphere to the location signal. Cain and his colleagues noticed that the atmosphere of another planet represents a source of error that cannot be neglected, but from which statements about the planetary atmosphere can be obtained. The difference to Eshleman was the observation methods based on the total time of flight. While Eshleman's Stanford team assumed a one-way mode, in which a transmitter on board the spacecraft should generate the reference signal, Cain and his colleagues at JPL proposed a two-way method, using the then new maser technology to produce a reference signal that could not be exceeded in terms of accuracy The ground station should be generated, which should then be received by the spacecraft and slightly modified in phase and sent back again.
Since the one-way method was not yet accurate enough with the technology at the time, NASA decided to use the two-way method for the first time during the Mariner-4 mission.
The importance of the new measurement method became clear in the early 1960s with the Mariner project, which also included a Mars landing. Such a landing places high demands on the design and the landing strategy of the spacecraft. Exact knowledge of the Martian atmosphere was essential, and although information from ground-based spectroscopy was available, there were doubts about the values measured at the time by de Vaucouleurs in 1950. As it turned out later, Vaucouleurs' assumption of atmospheric pressure of 100 hPa was much too high. Mariner 4 launched to Mars in 1964, with the question of surface pressure remaining unsolved. With the help of the new measurement technology, a pressure on the surface of Mars could be measured that was about two orders of magnitude below the guideline value at that time.
Measurement process
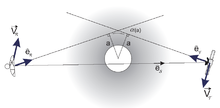
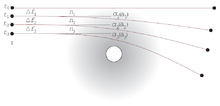
In the radio occultation experiment, a highly stable continuous wave in the micrometer range illuminates the planetary atmosphere to be examined. Transmission takes place in the so-called X-band at 8.4 GHz and in the so-called S-band at 2.3 GHz. With precise knowledge of all the speed components involved, frequency shifts can be assigned to the refractive index profile of the atmosphere due to the phase stability of the reference signals. Corresponding diffraction angles and beam parameters can be determined from this in a first step. The diffraction angle characterizes the deflection that a radio beam is subject to in the atmosphere. For each diffraction angle there is exactly one ray parameter that is perpendicular to the ray symptoms (Figure 2). In a further step, the associated refractive index can be determined by means of an Abel transformation .
The signal sent by the spacecraft, namely the shift in the received frequency relative to the transmission frequency, is measured with high precision at any point in time. The shifts in the measured frequencies result from the speeds of the transmitter and the receiver. An additional shift due to the illuminated medium is impressed on this classic Doppler effect . In order to extract this component of the frequency shift from the measured frequency data, the model frequency is subtracted from the measured data, which can be determined from the known speeds of the transmitter and receiver and does not contain any atmospheric components. This portion of the frequency shift is referred to as the residual frequency and ideally only contains portions of the medium being probed. The model frequency takes into account speed components from the rotation, nutation and precession of the earth, ideally also from the tidal effects as well as components from special and general relativity theory . Furthermore, to separate the frequency change of the carrier wave caused by the planet's atmosphere from those of the earth's atmosphere, the effects of the earth's atmosphere and earth's ionosphere must be taken into account using models and empirically determined values such as temperature, pressure and air humidity.

It is known that an electromagnetic wave is refracted and out of phase in a medium. It covers a longer distance compared to the vacuum signal. This can be expressed by the following formula:
- is the path extension of the beam as a function of the refractive index n along the curved beam path s from the transmitter to the receiver.
- is the corresponding phase shift at signal wavelength and is the corresponding (theoretical) path through the vacuum along the line of sight.
The atmospheric frequency shift corresponds to the time derivative of , so that in the implicit time-dependent probing experiment, an atmospheric frequency shift occurs:
With
f is the transmission frequency and c the speed of light in a vacuum.
In connection with the geometry of the radiosounding measurement and the involved velocity quantities, the above equation for the frequency shift can be combined with the involved kinematic quantities from Figure 2:
The atmospheric frequency shift is therefore the contribution made by the projection of the velocities onto the ray symptoms, minus the kinematic Doppler contribution along the line of sight. If one has obtained from a measurement , the above equation must be solved for the components. The assumption of spherical symmetry yields a second equation with Snellius' law of refraction on spherical surfaces ( Benndorff's law or Bouguer's law ). The two equations can be used to determine the unknown beam symptoms or and , which leads to the diffraction angle and beam parameters.
Coordinate transformation
Assuming spherical symmetry, it can be shown that the radio beam always moves in one plane in the direction of increasing refractive index. This plane, called the occultation plane in the following, is the reference system for calculating the flexion angle. Such a plane at a certain point in time is defined by the three points ground station, planet center and satellite position, as shown in Figure 3. In general, there is a new occultation plane at each point in time of the measurement, which must be calculated at each point in time.
All orbit data of the space probe, like the ephemeris, are in a certain coordinate system (KS). Usually this is the level of the mean earth equator, with reference to the dynamic equinox of epoch J2000 . To switch to the coordinate system of the occultation plane, two coordinate transformations are necessary. First in the planet-centric coordinate system, which is analogous to the above earth equator system, and then in the occultation plane. Figure 4 gives an overview of this. Other approaches are possible.
The calculation can be carried out, for example, with the SPICE ephemeris library . The Spice library is made freely available by the NAIF group (NASA) and is available in the source code. The NAIF group also provides the corresponding orbit data in Spice format.
Diffraction angle and beam parameters
The occultation plane, as shown in Figure 5, is spanned by the two axes z and r . The components of the individual velocity vectors can be specified in terms of these axes. The unknown directions of the unit vectors and the ray symptoms are specified by the angles shown between the ray symptoms at the ground station and the line of sight, as well as by the angle between the ray symptoms at the spacecraft and the line of sight. The angles between the coordinate axes and the line of sight are also shown; indicates the angle between the z-axis and the line of sight, is the angle between the r-axis and the line of sight.
The two unknown angles and can be solved iteratively using a system of equations. The system of equations is shown in detail in. Adding up the two unknown angles gives the angle of diffraction . The beam parameter then also results from one of the unknown angles and Snellius' law on spherical surfaces:
Once the diffraction angle and beam parameters have been determined for each beam, the refractive index associated with each diffraction angle can be calculated by means of an Abel transformation.
Abel Transformation and Refractivity

An Abel transformation is the solution of an Abel integral equation . Integral equations are characterized by the fact that the unknown function occurs as an integrand in a certain integral. Well-known integral equations are, for example, the Fourier transformation and the Hankel transformation . In the theory of integral equations, Abel's integral equation is assigned to the weakly singular Volterra integral equations of the first type, to which Niels Henrik Abel found a solution in 1826.
In general, problems in which the reconstruction of two-dimensional radially symmetrical distributions f (r ) is required from their projections g (y) lead to the Abel transformation. It is used, for example, in plasma physics, astrophysics or medical computed tomography. The relationship between the radial distribution f (r) and its projections g (y) leads to the equation:
where denotes the Abel transformation. A common form of the inverse Abel transformation is given by:
The measured diffraction angle corresponds to the Abel transformation of a radially symmetrical refractive index. An inverse Abel transformation of the angle results in the refractive index that can be specified. Fjelbo et al were able to show that an atmosphere with the refractive index profile bends a ray with ray parameters by the following amount:
At the ray periapsis, the point of closest approach of the ray to the planet, the product of the refractive index and radius is the same , where by the inverse Abel transform is determined:
The refractive index for air is a number close to 1 . To make this number easier to use, subtract 1 and multiply by , this is the refractivity N.
where the index of refraction is a function of the height h . The refractivity of the neutral atmosphere is the ability of the medium to react to the force of the electromagnetic wave, which is called dielectric polarization in electromagnetic theory . The polarization is defined as the averaging over many particles. This results in a proportionality of the refractivity to the particle density. The particle density is subject to the barometric altitude distribution, so that the refractivity is also a function of altitude. The change in refractivity that occurs at a certain level is dependent on the thermodynamic basic parameters pressure and temperature at this level, and ionized particles have a direct effect on the signal.
The corresponding radius of the ray periapsis is . It marks the point of the closest approach of the ray to the planet, this is shown in Figure 6 . Thus, after the Abel transformation, the diffraction angle profiles of the refractivity as a function of the height are available. With this information, height profiles of the characteristic features of the planetary atmosphere can be determined very precisely.
Temperature, pressure and density profiles
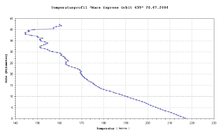
With the results from the previous section, the fundamental state variables of the neutral atmosphere can now be calculated. Pressure, temperature and density can be calculated from the proportionality of the refractivity to the number density , the ideal gas law and the hydrostatic basic equation. Furthermore, the electron density profile of the ionosphere can be calculated.
- Number density:
- where N denotes the refractivity. The proportionality constant is known from laboratory measurements and results for the main components of the Martian atmosphere (carbon dioxide, nitrogen and argon) .
- With this equation, the density can be calculated directly in the corresponding height range.
- Basic hydrostatic equation:
- where is density and number density;
- is the mean molecular mass and the gravitational acceleration.
- Ideal gas law:
- where is the pressure, the Boltzmann constant and the temperature.
- Electron density:
- where the electron density in the ionosphere is the refractivity and is the transmission frequency. With this equation, the electron density in the corresponding height range can be specified directly.
Examples
- Titan atmosphere
- The Voyager 1 space probe used radio occultation to determine the density, chemical composition and height of its atmospheric layers at Saturn's moon Titan .
- Determining the diameter of the moon
- The diameter of the moon could also be determined with the help of the occultation method. The high opacity (opacity) of the atmosphere made it impossible to optically determine the moon's diameter with the camera, but its diameter could be calculated from the time that elapsed from the signal on one side of the moon to when the signal reappeared on the opposite side of the moon become.
- GPS radio occultation method
- The German geoscientific satellite CHAMP (2000–2010) observed the signals from GPS satellites shortly before or after their occultation through the earth. From the comparison with the values that would be expected from a satellite without atmospheric disturbances, statements about the water content and temperature of the atmosphere can be derived.
Individual evidence
- ↑ a b c G. L. Tyler, B. Ahmad: Radio Occultation . Stanford University California, 2002. (draft book)
- ↑ A. Pannekoek: About the phenomena that occur when a planet is covered with stars . In: Astronomical News . tape 164 , 1904, pp. 5-10 .
- ↑ VR Eshleman, G. Fjeldbo: The Bistatic radar Occultation Method for the Study of Planetary Atmospheres. In: Journal of Geophysical Research. Vol. 70 (1965), p. 3217.
- ^ Yunck et al: Special issue of Terrestrial, Atmospheric and Oceanic Science. In: History of GPS Sounding. 11 (2000), pp. 1-20.
- ^ G. de Vaucouleurs: Physics of the Planet Mars. trans. Patrick Moore, Faber and Faber, London 1954.
- ^ A b D. D. Morabito, SW Asmar: Radio-Science Performance Analysis Software. In: TDA Progress Report. 42, JPL NASA (1995), pp. 120ff.
- ↑ a b B. Ahmad: Accuracy and resolution of atmospheric profiles obtained from radio occultation measurements. Scientific Report No. DPD811-1998-1, Stanford University, 1998.
- ↑ S. Remus: Investigations into the implementation of satellite-based radio science experiments in interplanetary space. Dissertation. University of the Federal Armed Forces, Munich 2004.
- ↑ GA Hajj et al .: A technical description of atmospheric sounding by GPS occultation. In: Journal of Atmospheric and Solar-Terrestrial Physics. Vol. 64, Issue 4 (2002), pp. 451-469.
- ↑ a b G. Fjeldbo, AJ Kliore, VR Eshleman: The Neutral Atmosphere of Venus as Studied with the Mariner V Radio Occultation Experiments. In: Astron. J. Vol. 76 no. 2 (1971), pp. 123-140.
- ↑ Pretzler et al .: Comparison of Different Methods of Abel Inversion Using Computer Simulated and Experimental Side-On Data. In: newspaper for nature research. Vol. 47a (1992), pp. 995-970.
- ↑ Jenkins: Variations in the 13 cm Opacity below the Main Cloud Layer in the Atmosphere of Venus Inferred from Pioneer-Venus Radio Occultation Studies 1978-1987. Dissertation. Georgia Institute of Technology, 1992
- ↑ DP Hinson et al .: Initial results from radio occultation measurements with Mars Global Surveyor. In: Journal of Geophysical Research. 104 E11 (1999), pp. 26297-27012.
- ↑ M. Pätzold et al .: MaRS: Mars Express Orbiter Radio Science. MARS EXPRESS: The Scientific Payload edited by A. Wilson (2004), pp. 141-163, ESA Publications Division
Further literature
- Dissertations
- J. Selle: Planning and simulation of radio science experiments of interplanetary space missions. Dissertation. University of the Federal Armed Forces, Munich 2005.
- J. Wickert: The CHAMP radio occultation experiment: algorithms, processing system and first results. Dissertation. Karl Franzens University Graz, Scientific Technical Report STR 02/07 (PDF; 11.8 MB), Potsdam, GFZ (2002)
- Others
- B. Stanek: Space Lexicon. Halwag Verlag, Bern 1983, ISBN 3-444-10288-7 , p. 214.
- Axel von Engeln: Satellite based Temperature Profile Determination using Passive Microwave and Radio Occultation Instruments. Logos Verlag, Berlin 2000, ISBN 3-89722-453-4 .


![{\ displaystyle \ Delta f _ {\ text {atm}} = {\ frac {f} {c}} [({\ vec {V}} _ {\ mathcal {T}} \ cdot {\ hat {e}} _ {\ mathcal {T}} + {\ vec {V}} _ {\ mathcal {R}} \ cdot {\ hat {e}} _ {\ mathcal {R}}) - ({\ vec {V} } _ {\ mathcal {T}} \ cdot {\ hat {e}} _ {\ mathcal {S}} - {\ vec {V}} _ {\ mathcal {R}} \ cdot {\ hat {e} } _ {\ mathcal {S}})]}](https://wikimedia.org/api/rest_v1/media/math/render/svg/09c18f8c1b906fd48c5fefb505771495558a71ea)


