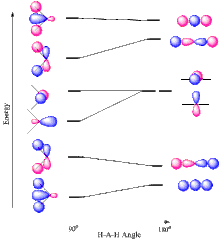
Walsh diagram

A Walsh diagram is a graphic representation in which the geometry of a molecule is plotted against the energy level of the atomic orbitals involved . It allows predictions to be made about bond angles in small molecules with the same number of valence electrons and subsequently also about reactivity .
history
After preliminary work by Robert Mulliken , Arthur Donald Walsh published interpretations on the subject in 1976. He plotted ionization energies versus bond angles.
Creation
The molecule is viewed in the ground state using the Hartree-Fock method ; Electrons that are not valence electrons are not taken into account. Then individual states are calculated which deviate from this basic equilibrium state. The energy is calculated for each point, e.g. B. as a harmonic oscillator or Morse potential as cases of a Born-Oppenheimer approximation . The calculation is carried out for several angles with the same bond length .
literature
- Walsh, AD (1976). "Some Notes on the Electronic Spectra of Small Polyatomic Molecules". Int. Rev. Sci .: Phys. Chem., Ser. Two 3: 301-316.
- Wolfgang Demtröder: Molecular Physics: Theoretical Foundations and Experimental Methods . Oldenbourg Verlag, 2003, ISBN 3-486-24974-6 , p. 254 ( limited preview in Google Book search).