Activity diagram
| Structure diagrams of the UML |
|---|
| Class diagram |
| Component diagram |
| Composition structure diagram |
| Object diagram |
| Package diagram |
| Profile diagram |
| Distribution diagram |
| UML behavioral diagrams |
| Activity diagram |
| Use case diagram |
| Interaction overview diagram |
| Communication diagram |
| Sequence diagram |
| Timing diagram |
| State diagram |
An activity diagram (English activity diagram ) is a behavior diagram of the Unified Modeling Language (UML), a modeling language for software and other systems, and provides the networking of elementary actions and their connections with control and data flows graphically.
General
An activity diagram is usually used to describe the course of a use case , but it is suitable for modeling all activities within a system.
In the UML 2 is the semantics of the activity diagrams of further of Petri nets close and enables the display of concurrent systems by the incorporation of additional mechanisms asynchronous communication ( signal transmission and reception, exception handling). An activity diagram specifies an activity . The detailed rules for how tokens flow in an activity form the basis for interpreting an activity diagram.
The activity diagram is an object-oriented adaptation of the program flow chart (PAP, often also referred to as a program flow diagram).
UML 2 activity diagram
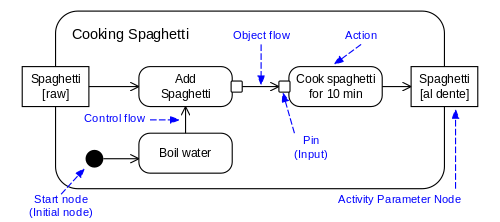
The figure on the right shows an example of a simple activity diagram with a header and a content area. For an activity diagram, the keyword in the header is actor activity. On the edge there are two activity parameter nodes as rectangles . At two of the actions (here rectangles with rounded corners) the input and output pin (small squares on the edge) can be seen, which are connected via an object flow . The remaining arrows represent control flows . The black circle is the start node (belongs to the control nodes ).
UML 1 activity diagram
Activity diagrams in UML 1.x look similar to activity diagrams in UML 2, but the meaning of individual graphic symbols has changed significantly in the new language version. In particular, no distinction is made between activities and actions, and there are (consequently) no pins.
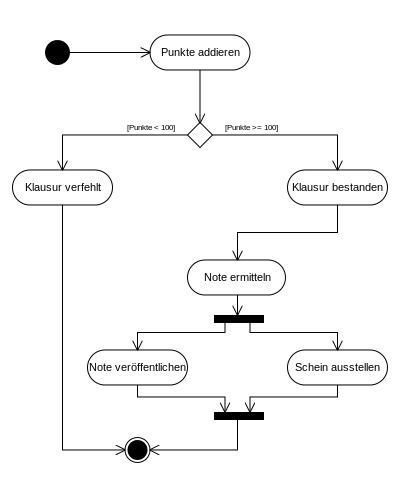
The horizontal, thick lines are so-called parallelization and synchronization nodes (or bars) and can split or merge control flows. The diamond (shown here as an inverted square) is used to model a split of the control flow into alternative branches. The conditions are in square brackets at the respective branch.
The difference between the diamond symbols and bar symbols shown in the graphic below and each for certain control nodes can be interpreted using token semantics as follows: The number of tokens is retained for the rhombuses and the number of tokens is modified for the bars.
literature
- Christoph Kecher: UML 2.0 - The comprehensive manual . Galileo Computing, 2006, ISBN 3-89842-738-2
- Heide Balzert: Textbook of Object Modeling - Analysis and Design with UML 2 . Elsevier Spectrum Academic Publishing House, 2005, ISBN 3-8274-1162-9

