Population development of Eberswalde
This article shows the population development of Eberswalde in tables and graphs.
On December 31, 2019, "was Official population " of Eberswalde after updating the Statistical Office Berlin-Brandenburg 40699 (only primary residences and by comparison with the other country offices ).
Population development of Eberswalde
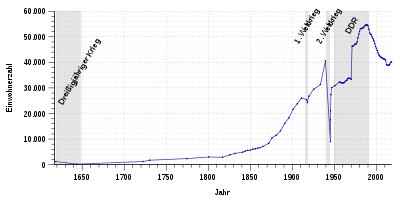
In the Thirty Years War Eberswalde lost almost its entire population. The population decreased from 1200 in 1618 to 168 in 1643; it only reached the pre-war level again in 1722. In the 18th century the population of Eberswalde grew only slowly. It was not until the beginning of industrialization in the 19th century that population growth began. In 1800 almost 3000 people lived in Eberswalde, in 1898 there were already 20,000. By 1939 this number had doubled to just under 41,000.
During the Second World War , the city lost 78 percent of its population. The population sank to 9,000 by the end of April 1945, then rose very quickly after the end of the war due to the return of the Eberswalder who fled from the Soviet troops and was 17,500 again on May 2, 1945 and around 21,000 at the end of June 1945.
On March 20, 1970, the cities of Eberswalde (33,400 inhabitants 1969) and Finow (11,767 inhabitants 1969) merged to form the city of Eberswalde-Finow with around 45,000 inhabitants. In 1988 the city had the highest population in its history with 54,822. In 1993 the city was renamed Eberswalde . Up to 1994 up to 25,000 Soviet soldiers were stationed in Eberswalde, the exact number is unknown.
In 1990, 435 foreigners (0.83 percent) were registered with the city administration. This number fell to 299 (0.58 percent) by the end of 1991 due to the premature termination of employment contracts by the companies and emigration. By 2000, the number of foreigners grew again to 550 people (1.23 percent). In recent years, the proportion of foreigners in the total population has risen continuously and in 2008 was 1.9 percent (780 people). Since the fall of the Wall in the GDR , the city has lost 25.3 percent of its inhabitants (13,878 people) due to emigration and a decline in the birth rate due to high unemployment. On December 31, 2010, 40,944 people were still living in the city. The population between 35,000 and 40,000 is expected to stabilize by 2020.
The following overview shows the number of inhabitants according to the respective territorial status. Up to 1800 these are mostly estimates, then census results (¹) or official updates from the city administration (until 1944), the state central administration for statistics (1945 to 1989) and the state statistical office (from 1990). From 1840 the information relates to the “customs clearance population”, from 1871 to the “local population”, from 1925 to the resident population and since 1966 to the “population at the place of the main residence”. Before 1840, the number of inhabitants was determined according to inconsistent survey methods.
From 1618 to 1944
(respective territorial status)
|
|
|
Notes:
1 Census result
2 according to Frauke Gränitz, Luise Grundmann, Rolf Schmidt: Um Eberswalde, Chorin and the Werbellinsee , Böhlau Verlag Köln Weimar, 2002; Page 339
From 1945 to 1989
Before the fall of the Wall, the following Soviet units were stationed in Eberswalde:
- 20th Guard Army ( Headquarters )
- 899th Airborne Battalion
- 255th Repair Battalion
- 307th Repair Battalion
- 423rd Radio Battalion
- 247th Rifle Battalion
- 81st Guard Mot. Rifle Regiment
- 787th Fighter Regiment
- 41st helicopter squadron
- 117th Rear Brigade
- 793. Military Hospital
The staff of the 20th Guard Army alone included 10,000 members of the army and 5,000 civilian employees who were not included in the population statistics. A total of around 30,000 soldiers of the Soviet Army were stationed in the Eberswalde area. Including civilian workers and children, there were about as many Soviet citizens living in Eberswalde as there were Germans, but the population of about 100,000 was never officially communicated.
(respective territorial status)
|
|
|
Notes:
1 Census result
2 according to Frauke Gränitz, Luise Grundmann, Rolf Schmidt: Um Eberswalde, Chorin and the Werbellinsee , Böhlau Verlag Köln Weimar, 2002; Page 339
Source: State Central Administration for Statistics
Since 1990
|
|
|
Territory of the respective year, number of inhabitants, from 2011 based on the 2011 census
Population development of Finow
The following overview shows the population of Finow (until 1928 Heegermühle) according to the respective territorial status.
|
|
Note:
1 census result
Birth and migration balance
Birth balance and migration balance according to the respective territorial area.
| year | Born | Died | Birth balance |
Immigration | Departures | Migration balance |
Population balance |
|---|---|---|---|---|---|---|---|
| 1991 | 402 | 620 | −218 | 954 | 1809 | −855 | −1073 |
| 1992 | 301 | 602 | −301 | 1080 | 1295 | −215 | −516 |
| 1993 | 266 | 586 | −320 | 1034 | 1601 | −567 | −887 |
| 1994 | 263 | 648 | −385 | 1183 | 1588 | −405 | −790 |
| 1995 | 258 | 564 | −306 | 1344 | 1766 | −422 | −728 |
| 1996 | 318 | 524 | −206 | 1307 | 1902 | -595 | −801 |
| 1997 | 301 | 511 | −210 | 1502 | 2337 | −835 | −1045 |
| 1998 | 336 | 532 | −196 | 1521 | 2441 | −920 | −1116 |
| 1999 | 325 | 448 | −123 | 1614 | 2257 | −643 | −766 |
| 2000 | 308 | 466 | −158 | 1553 | 2256 | −703 | −861 |
| 2001 | 289 | 455 | −166 | 1638 | 2426 | -788 | −954 |
| 2002 | 337 | 468 | −131 | 1632 | 2269 | -637 | −768 |
| 2003 | 307 | 530 | −223 | 1818 | 2050 | -232 | −455 |
| 2004 | 288 | 471 | −183 | 1937 | 2056 | -119 | −302 |
| 2005 | 355 | 474 | -119 | 1700 | 1910 | -210 | −329 |
| 2006 | 348 | 451 | -103 | 1757 | 1864 | -107 | −210 |
| 2007 | 343 | 499 | -156 | 1645 | 1886 | -241 | -397 |
| 2008 | 368 | 470 | -102 | 1960 | 1923 | 37 | -65 |
| 2009 | 337 | 490 | -153 | 2012 | 2017 | -5 | -156 |
| 2010 | 319 | 493 | -174 | 2016 | 2072 | -56 | -231 |
Source: Berlin-Brandenburg Statistics Office
City and districts
The population figures refer to December 31 of each year (main residences).
| No. | Surname | 2001 | 2005 | 2008 |
|---|---|---|---|---|
| 1 | City center | 12,318 | 12,252 | 12,567 |
| 2 | Ostend | 3,329 | 3,237 | 3,154 |
| 3 | North end | 2,775 | 2,689 | 2,724 |
| 4th | West end | 5,310 | 5,068 | 4,892 |
| 5 | Finow | 8,650 | 8,468 | 8,467 |
| 6th | Finowtal (BBV) 1 | 9,307 | 7,988 | 7.139 |
| 7th | Clara Zetkin settlement | 993 | 1,050 | 1.008 |
| 8th | Sommerfelde | 435 | 449 | 418 |
| 9 | Tornow | 341 | 331 | 319 |
| 10 | Spechthausen 2 | 160 | ||
| Eberswalde | 43,458 | 41,532 | 40,848 |
1 BBV = Brandenburg Quarter
2 Incorporation on January 1, 2006
Source: City of Eberswalde
literature
- Records of the Maria Magdalenen Congregation 1618–1800
- Karl Friedrich Wilhelm Dieterici (ed.): Communications from the Statistical Bureau in Berlin , 1848–1861
- Imperial Statistical Office (Ed.): Statistical Yearbook for the German Empire , 1880–1918
- Statistisches Reichsamt (Ed.): Statistical yearbook for the German Reich , 1919–1941 / 42
- German Association of Cities (Ed.): Statistical Yearbook of German Communities , 1890 ff.
- State Central Administration for Statistics (Ed.): Statistical Yearbook of the German Democratic Republic , 1955–1989
- Bertelsmann Foundation (ed.): Who, where, how many? - Population in Germany 2025. Practical knowledge for municipalities. Bertelsmann Stiftung publishing house, Gütersloh 2009, ISBN 978-3-86793-042-0
Web links
- Office for Statistics Berlin-Brandenburg: Online tables
- Bertelsmann Foundation: Guide to the community
Individual evidence
- ↑ Population development and areas of independent cities, districts and municipalities in the State of Brandenburg 2016 , p. 9
- ↑ Transodra: On the reception and integration of the displaced persons in Eberswalde 1945 - 1948
- ↑ Список всех войсковых соединений ГСВГ (List of all military units of the GSSD)
- ↑ Foreign home Eberswalde? - Immigration in the past and present ( memento of the original from July 19, 2016 in the Internet Archive ) Info: The archive link was inserted automatically and has not yet been checked. Please check the original and archive link according to the instructions and then remove this notice. Booklet accompanying the special exhibition in the context of the Kulturland Brandenburg 2003 EUROPA, page 38
- ^ ZWA Eberswalde : The Eberswalde sewage treatment plant
- ↑ Historical municipality register of the state of Brandenburg 1875 to 2005. District Barnim . Pp. 14-17
- ↑ Population in the state of Brandenburg from 1991 to 2015 according to independent cities, districts and municipalities , Table 7
- ^ Office for Statistics Berlin-Brandenburg (Ed.): Statistical report AI 7, A II 3, A III 3. Population development and population status in the state of Brandenburg (respective editions of the month of December)
- ^ City of Eberswalde: City of Eberswalde. Annual statistical report 2008


