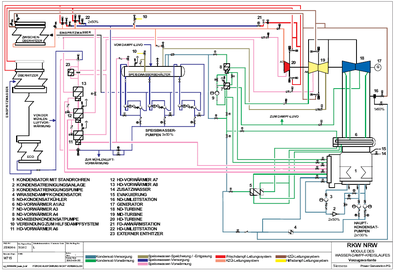
Flow diagram
The flow diagram (flow diagram, flow diagram, flow diagram) is an aid in the form of a technical drawing within process engineering . It shows the individual process sections in a schematic form. The presentation is regulated according to EN ISO 10628 (national: among others DIN EN ISO 10628, ÖNORM EN ISO 10628). Within this standard , depending on the degree of abstraction, a distinction is made between the basic flow diagram, process flow diagram, pipeline and instrument flow diagram.


Basic flow diagram
The basic flow diagram is the representation of a process or a process engineering plant in a simple form. The representation is done with the help of rectangles (meaning: e.g. process stages , basic operations, process engineering systems, system parts), therefore also called block flow diagram , which are connected by lines or arrows (meaning: flow line for e.g. materials, energy, energy carriers) become. It contains the designation of the input and output materials ( starting materials and products ). Material flows, energy carriers, flow rates and characteristic operating conditions (pressure, temperature, concentrations) can be specified as additional information.
Process flow diagram
The process flow diagram (PFD: Process Flow Diagram ) is the representation of a process with the aid of graphic symbols that are connected by lines. The graphic symbols mean plant components (equipment and machines), the lines flow lines for materials and energies or energy carriers. The production process is described more specifically, devices are listed, specified with abbreviations and quantitative information is provided. Operating data such as material and energy flows can be noted. The process flow diagram is the most important planning document for plant operation, expansion and communication between the specialist departments, as the physical and chemical function of a plant is documented.
Piping and instrument flow diagram
The level of detail has increased further here. The pipeline and instrument flow diagram (also: P&ID: Piping and Instrumentation Diagram ) shows the connection of the lines, the flow directions and all the fittings in a pipeline. In addition, connection types such as flange or welded connections can be shown and the pipelines are labeled. The designation reveals the nominal size, the medium ( fluid ), the pipe class to be used and the insulation to be used . The P&ID flow diagram should, if possible, correctly reproduce the geometric course of the pipeline; data for lines with a gradient must be entered for the pipeline construction. The height and size of the apparatus should be recognizable. The representation of the pipe symbols is regulated by DIN 28000-4: 2014-07 / DIN EN ISO 10628-1: 2015-04 / DIN EN ISO 10628-2: 2013-04. All measuring points to be built into the pipelines are drawn and labeled. In addition, all active lines are control - and control bodies in accordance with DIN EN 62424: 2010-01; VDE 0810-24: 2010-01 shown. The transition of a pipeline shown to another P&ID flow diagram is indicated by a labeled box, usually in the form of an arrow, as in the basic flow diagram.
In the P&ID flow diagram, i. d. Usually no more process parameters are shown, the chemical and physical functioning of a chemical plant remains hidden. The pipeline and instrument flow diagram is the relevant basic document for pipeline and instrument planning.