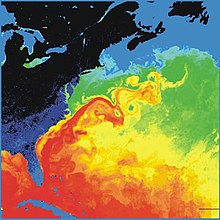
Sea surface temperature

The sea surface temperature (Engl. Sea surface temperature , often abbreviated SST ). is, in the definition of the German Weather Service , the water temperature one meter below the immediate sea surface . More generally, the term is used for temperatures at depths of one micrometer to a few meters.
The sea surface temperature is a key meteorological and climatological parameter, as it determines both the thermohaline circulation of the sea and its heat exchange with the earth's atmosphere . The entire heat content of the oceans is determined , among other things, with immersion probes and abbreviated in English with OHC ( ocean heat content ). The heat content of the oceans has gained importance in climatology in recent years .
Important parameters, which are directly or indirectly based on the sea surface temperature and their spatial differences, are the Southern Oscillation Index and the North Atlantic Oscillation . The SST therefore plays a major role for El Niño and La Niña as well as for monsoon phenomena and especially the Indian monsoons .
There are different ways of measuring the SST, although there can be considerable differences in the measurement accuracy between these methods , as they are subject to errors of different sizes. At first a direct measurement by thermometer was used , either manually by measuring a water sample or automatically by ships. The data material obtained in this way, however, has considerable inaccuracies because, for example, due to a different depth or an inconsistent position of the measuring device, measurements are not always carried out at the same depth. Better and much more reliable data can therefore be obtained from stationary buoys . Their measurement data are usually transmitted via satellites and automatically evaluated there. An advantage here is not only the same depth of measurement, but also the fixed position. This results in continuous measurement series for defined points and avoids a distortion of the data set due to a spatially and temporally different data situation, depending on whether or not a ship with measuring equipment is currently present at a certain location. However, there is also a problem that the buoys are only suitable for high seas to a very limited extent and therefore often only cover the coastline.
Since the 1980s, therefore, satellite measurements have been increasingly used, which have the advantage of covering the entire area in almost the same time, in contrast to the above point measurements. Here, the ocean with electromagnetic radiation is infrared - wavelength range scanned (see figure description of the illustration top right). The importance of satellite measurements can be seen in direct comparison with their alternatives. The satellites enable a high-resolution overview in a comparatively very short period of time. A ship traveling at ten knots takes about ten years to cover the same section as a satellite in just two minutes. However, measuring the absolute SST using satellites also has disadvantages. It only covers the top millimeter of the ocean and therefore does not represent the real SST due to the depth-dependent warming effect of the sun, the cooling at night and surface evaporation. A comparability of direct temperature measurements by buoys and ships with the measurement data of the satellites is therefore only given to a very limited extent, which leads to considerable evaluation problems with relevant temperature differences of often a tenth of a degree. In addition, satellite measurements are disturbed by the cloud cover and can therefore themselves have inconsistencies if these disturbances are not compensated for. However, these problems are minor compared to the advantages of a satellite-based measurement. A uniform SST data set is regularly obtained from satellite and in-situ measurements.
Individual evidence
- ↑ Climate maps of the water surface temperature - Climate monitoring Europe - Maps of the water surface temperature for the WMO region RA VI. German Weather Service, accessed on January 15, 2019 .
- ↑ M. Kucera: Determination of Past Sea Surface Temperatures . In: Encyclopedia of Ocean Sciences . 2009.
- ↑ a b Sea Surface Temperature. Physical Oceanography Distributed Active Archive Center, accessed January 15, 2019 .
- ↑ Lynne D. Talley, George L. Pickard, William J. Emery, James H. Swift: Descriptive Physical Oceanography . 2011, ISBN 978-0-7506-4552-2 , 4 Typical Distributions of Water Characteristics, doi : 10.1016 / C2009-0-24322-4 .
- ↑ Lynne D. Talley, George L. Pickard, William J. Emery, James H. Swift: Descriptive Physical Oceanography . 2011, ISBN 978-0-7506-4552-2 , S15 Climate and the Ocean, doi : 10.1016 / C2009-0-24322-4 ( elsevier.com ).
- ↑ Lynne D. Talley, George L. Pickard, William J. Emery, James H. Swift: Descriptive Physical Oceanography . 2011, ISBN 978-0-7506-4552-2 , 1 Introduction to Descriptive Physical Oceanography, doi : 10.1016 / C2009-0-24322-4 .
- ↑ a b c Lynne D. Talley, George L. Pickard, William J. Emery, James H. Swift: Descriptive Physical Oceanography . 2011, ISBN 978-0-7506-4552-2 , S16.4.2.1. Sea-Surface Temperature, S16.9.5. Sea-Surface Temperature from Satellite Remote Sensing, doi : 10.1016 / C2009-0-24322-4 ( elsevier.com ).
