Area under the curve

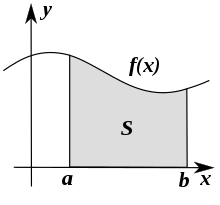
The area under the curve ( english area under the curve , in short: AUC ) corresponds mathematically to the definite integral and is an elementary application of integral calculus .
Natural sciences
The term has not found application in most of the natural sciences , although certain integrals are often used (for example, the distance covered is the integral of speed over time) and is limited to pharmacokinetics . In this sub-area of pharmacology , the term was introduced by Dost as the “principle of the corresponding surfaces” .
Medicine / pharmacokinetics

In medicine and pharmacology , the area under the curve (AUC) describes the area under the concentration-time curve of a drug in the blood . It is the quantity by which the bioavailability of a drug is expressed. The German-language equivalent “area under the curve” has not established itself in the specialist literature.
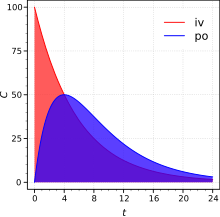
The concentration of the drug in the blood after administration is measured at certain time intervals. For an orally administered drug, the concentration-time curve resulting from the measurement has a typical profile, which is composed of the speed at which the drug is transferred into the systemic bloodstream and the kinetics of its excretion (blue area in the figure, see also Bateman Function ). In the case of intravenous administration, a concentration-time curve results which is practically only determined by the elimination kinetics (red area).
The value of AUC [unit: (mass / volume) × time] is proportional to the bioavailable amount of the drug, i.e. H. the proportion of the total administered dose (D) that enters the bloodstream, regardless of the type of application. For a substance administered intravenously, the bioavailability (F) is 100% by definition. If the AUC for oral administration of a drug is the same as for intravenous administration, the bioavailability is also 100%; if it is lower, the bioavailability is correspondingly lower.
Calculation from parameters of a pharmacokinetic model
Using the example of the Bateman function (concentrations after oral administration in the one-compartment model)
the AUC results from integration with respect to time.
Every linear compartment system can also be represented empirically as a sum of exponential terms.
The general rule is
Linear trapezoid rule
Linear interpolation is made between the measured concentrations ; the AUC up to the last measurement time is approximated by adding up the areas of trapezoids .
The remaining area is calculated with the help of the estimated elimination constants .
The concentration at the last time of collection is usually because of the proximity to the analytical detection limit subject to the greatest uncertainty. An alternative method of calculating the remaining area therefore uses its estimated value instead of the last concentration measured .
Log-linear trapezoidal rule
Since the concentrations in the area of elimination follow an exponential course, the partial areas are systematically overestimated according to the point in time of the maximum concentration when the linear trapezoidal rule is applied. The remedy is logarithmic interpolation .
However, the method cannot be used with or (in these cases the corresponding partial area is calculated linearly). To avoid rounding errors, the method should be replaced by the linear method in this interval as well. In practice, a combination of both methods is often used, with the linear trapezoidal rule being used for increasing or constant concentrations and the log-linear rule for decreasing concentrations.
Alternative procedures
Other methods of numerical integration, such as Simpson's rule , cubic splines, and Lagrange polynomials, have not gained acceptance in pharmacokinetic practice and are not available in commercial software packages.
Psychological diagnostics
The area under the curve (AUC) parameter is used in psychological diagnostics to determine , for example, the probability of certain score intervals in a psychometric test , as an effect variable in ROC analyzes, to determine the selectivity , the discriminative validity of an instrument, etc.
Individual evidence
- ↑ Lothar Sachs , Jürgen Hedderich: Applied Statistics: Collection of Methods with R. 8., revised. and additional edition. Springer Spectrum, Berlin / Heidelberg 2018, ISBN 978-3-662-56657-2 , p. 669.
- ↑ a b K. Aktories, U. Förstermann, F. Hofmann and K. Starke: General and special pharmacology and toxicology. 10th edition. Munich, Elsevier 2009. ISBN 978-3-437-42522-6
- ↑ Wolfgang A. Knorre: Pharmacokinetics . Theoretical foundations and practical applications. Friedr. Vieweg and Son, Braunschweig / Wiesbaden 1981, ISBN 3-528-06862-0 .
- ↑ L. Dettli, JW Faigle, H. Hess, GF Kahl, F. Langenbucher, J. Meier, E. Mutschler, E. Nüesch, H. Rettig: Biopharmazie . Theory and Practice of Pharmacokinetics. Georg Thieme Verlag, Stuttgart / New York 1981, ISBN 3-13-603101-6 .
- ^ Ernst Glaser: Pharmacokinetics . Fundamentals, linear models, calculation methods, evaluation methods. pmi-Verlag, Frankfurt am Main 1985, ISBN 3-89119-011-5 .
- ↑ KC Yeh, KC Kwan: A Comparison of Numerical Integration Algorithms by Trapezoidal, Lagrange, and Spline Approximation . In: Journal of Pharmacokinetics and Biopharmaceutics . tape 6 , no. 1 , 1978, p. 79-89 , doi : 10.1007 / BF01066064 (English).
- ↑ KC Yeh, RD Small: Pharmacokinetic evaluation of stable piecewise cubic polynomials as numerical integration functions . In: Journal of Pharmacokinetics and Biopharmaceutics . tape 16 , no. 6 , 1989, pp. 721-740 , doi : 10.1007 / BF01062126 (English).
- ^ Robert D. Purves: Optimum Numerical Integration Methods for Estimation of Area-Under-the-Curve (AUC) and Area-under-the-Moment-Curve (AUMC) . In: Journal of Pharmacokinetics and Biopharmaceutics . tape 20 , no. 3 , 1992, p. 211-226 , doi : 10.1007 / BF01062525 (English).
- ↑ Lothar Sachs, Jürgen Hedderich: Applied Statistics: Collection of Methods with R. 8., revised. and additional edition. Springer Spectrum, Berlin / Heidelberg 2018, ISBN 978-3-662-56657-2 , p. 566.
literature
- Aktories, Förstermann, Hofmann (eds.): General and special pharmacology and toxicology (founded by Forth, Henschler, Rummel). 9th edition 2004, Elsevier Urban & Fischer Verlag, ISBN 978-3-437-42521-9
- Johan Gabrielsson, Dan Weiner: Pharmacokinetic & Pharmacodynamic Data Analysis . Concepts and Applications. 4th edition. Swedish Pharmaceutical Press, Stockholm 2007, ISBN 978-91-976510-0-4 , 2.8 Non-Compartmental Analysis, pp. 161-180 (English).
- Milo Gibaldi, Donald Perrier: Pharmacokinetics . In: Drugs and the Pharmaceutical Sciences . 2nd Edition. Volume 15. Marcel Dekker, Inc., New York, Basel 1982, ISBN 0-8247-1042-8 , chap. 11 , p. 409-417 (English).
- Günther Pabst: Parameters for Compartment-free Pharmacokinetics . Standardization of Study Design, Data Analysis and Reporting. Ed .: Willi Cawello. Shaker Verlag, Aachen 1999, ISBN 3-8265-4767-5 , 5. Area under the concentration-time curve, p. 65-80 (English).
- Malcolm Rowland, Thomas N. Tozer: Clinical Pharmacokinetics . Concepts and Applications. 4th edition. Lippincott Williams & Wilkins, a Wolters Kluwer business, Baltimore, Philadelphia 2010, ISBN 978-0-7817-5009-7 , Appendix A, pp. 687-690 (English).


