
Isodemographic map
An isodemographic map ( old Greek isos , equal 'and démos , people') is an anamorphic cartogram that shows demographic properties. It is based on a true-to-scale map and changes the size of individual areas according to certain demographic characteristics. Using colors and symbols, further properties can be displayed and mixed forms with e.g. B. generate political maps or climate maps .

Share of the population of individual member states in the total EU population (January 2008); the colors show different population densities

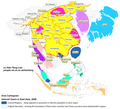
Status of the National Popular Vote Interstate Compact to change the election of the US President in the direction of a nationwide proportional representation in June 2008, a true-to-scale map above, an isodemographic map below according to the percentage of the votes of the individual US states in the total votes for the 2008 election ; for the meaning of the colors see the picture description
Mixed form of anamorphic map and true-to-scale map: Colored regions show the proportion of individual regions in the total number of Internet users in all areas in East and Southeast Asia recorded here (2008), regions not colored are shown true to scale

Population proportions of selected regions of the world , one box corresponds to one percent of the world population ; the colors summarize an area considered as a unit (2005)


Share of the population of individual municipalities in the total population of Sweden (November 2008)

Proportion of valid votes of individual municipalities in total votes for the election to the Swedish Reichstag 2006 ; the colors of the individual regions correspond to the voting share of the respective coalition (red: SAP , Greens and Left Party , blue: alliance for Sweden )


attachment
Web links
- Isodemographic map of Germany according to the population of the districts (1998) (website of the Spektrum der Wissenschaft Verlagsgesellschaft )
- Isodemographic map of Austria 1900 and 2001 on gisaustria.at
References and comments
- ^ Jürgen Bähr : Population geography . In: Ulrich Mueller, Bernhard Nauck , Andreas Diekmann (Hrsg.): Handbook of Demography. Springer-Verlag, Berlin Heidelberg New York 2000, Volume 2, p. 879 at the bottom of Google books , ISBN 3-540-66108-5 , last checked on April 28, 2011