world population
The world population or earth population is the number of people who live on the earth or who lived at a certain point in time (or, according to projections , will live). The disciplines of demography and population geography examine the status, historical development, spatial distribution and dynamics of the world population and create forecasts .
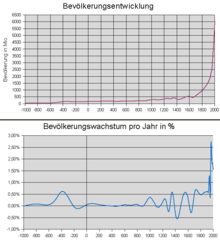
The world population in May 2020 was around 7.8 billion people. The UN calculated for the period 2015-2020 with a population growth of around 78 million people per year. The United Nations expects around 9.7 billion people to be around the world by 2050. For the year 2100 10.9 billion people are forecast. According to the World Population Report of the United Nations Population Fundthe seven billion people mark was exceeded on October 31, 2011. The determination of a day is to be understood as a symbolic act, because this estimate of the world population is subject to an uncertainty of up to ± 5%. The eight billion people mark is expected to be exceeded in the course of 2023. At the moment, the country with the largest population is China with 1.4 billion people.
Historical development of the world population
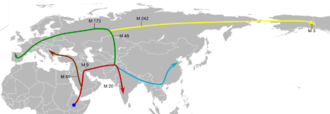
The modern man ( Homo sapiens ) is after the extinction of Neanderthals 30,000 years ago and Homo floresiensis 60,000 years ago, the only surviving type of the genus Homo . According to the theory of genetic bottleneck modern man suffered the most threatening to its existence decline in its population from 75,000 years ago, when after the eruption of super volcano Toba (now Lake Toba on Sumatra were able to save only 1,000 to 10,000 people worldwide) (see also Toba- Catastrophe theory ). After that , modern man spread from Africa to all other continents . By the end of the last glacial period 10,000 years ago, around 5 to 10 million people lived around the world.
The size of the world population 2000 years ago is estimated at 170 to 400 million, the UN assumes 300 million. The Roman Empire is said to have counted 57 million people at the beginning of our era, the Chinese Empire 75 million. 1000 years ago there were 250 to 350 million people, the UN assumes 310 million. After this standstill in population development in the first millennium of our era, growth began again in the High Middle Ages , but suffered incursions from plague , smallpox and other epidemics in the late Middle Ages .
500 years ago the world population was 425 to 540 million, the UNO assumes 500 million. In the course of the 16th century , the American population ( Indians ) is said to have declined from around 50 million to only 5 million as a result of introduced epidemics, while in Europe and Asia the population continued to increase. Global growth rose steadily over 0.5% in the 18th century and in the middle of the 20th century even over 2% for a few decades, so that one can speak of a population explosion.
Modern times
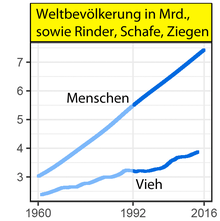
After the year 1700 the population grew rapidly. For the first time in human history, the doubling time was in the range of centuries and finally decades. Around 1804 the world population exceeded one billion people. During the 20th century, the world population has increased roughly three and a half times:
- 1804: 1 billion
- 1927 (after 123 years): 2 billion
- 1960 (after 33 years): 3 billion
- 1974 (after 14 years): 4 billion
- 1987 (after 13 years): 5 billion
- 1999 (after 12 years): 6 billion
- 2011 (after 12 years): 7 billion people
In 2023 (after 12 years) a world population of 8 billion is expected. With a population growth of around 80 million people annually, the number of people on earth increases by almost 220,000 every day and by over 150 people every minute.
Annual growth has been decreasing again in percentage terms since the late 1960s : from 2.1% at the time to 1.09% in the period 2015–2020. Annual world population growth has stagnated in absolute terms since the late 1980s. It's around 80 million a year.
The total number of children under the age of 15 is just under 2 billion. It rose from 1960 (1.127 billion), reached a first peak in 2001 (1.847 billion) and then decreased again somewhat (to 1.834 billion in 2005); this number was only exceeded again in 2008 (1.851 billion). In 2018 the number was 1.958 billion. While the total number (absolute number) almost doubled between 1960 and 2000, their (relative) share has decreased significantly during this time. Their share rose briefly from 37% of the world population from 1960, reached a maximum of 38% in 1966 and then fell continuously to 25.8% (as of 2019).
The majority of the population growth is currently taking place in the developing countries or in the less developed and poorer countries of the world. In contrast, in some more developed countries - especially most of the former Eastern Bloc - the population is declining.
Forecasts and scenarios
From the catastrophe theory of Thomas Malthus in 1798 to the present day, prognoses mostly clearly overestimated the actual population development. One of the main reasons is false prognoses for the People's Republic of China . Population growth there fell more sharply than expected. In the 1960s, the pessimistic forecast by a statistician in the USA caused a sensation, who announced for June 21, 2116 that there would only be one standing room on earth for every person .
In 2010, the UN expected a mean projection of 8.17 billion people by 2025 and 10.9 billion by 2100. In 2019, the UN forecast an increase to 8.5 billion people by 2030 (10% increase), to 9.7 billion in 2050 (26%) and to 10.9 billion in 2100 (42%). The population in Sub-Saharan Africa will double by 2050 (99%). For Oceania excluding Australia / New Zealand, an increase of 56% is expected from 2019 to 2050, for North Africa and West Asia of 46%, for Australia / New Zealand by 28%, for Central and South Asia by 25%, for Latin America and the Caribbean by 18%, for East and Southeast Asia by 3% and for Europe and North America by 2%.
The Institute for Health Metrics and Evaluation (IHME) at the University of Washington in Seattle, on the other hand, expects only 8.8 billion people in 2100, 2 billion fewer than the UN in 2019.
In 1975 the UN expected 7.6 billion people in 2010 (0.7 billion too high) and 12.3 billion in 2100.
In 2015 it was assumed that the mean number of children ( fertility rate ) would drop from 2.5 children per woman worldwide by 2100 below the so-called substitute level (2.1) to two children per woman.
If the mean number of children were half a child per woman higher, the world population would grow to 16.6 billion people by 2100 (high variant). With half a child less, only 7.3 billion people would be living on earth in 2100 (low variant).
In addition to the fertility rate, life expectancy - which are generally assumed to continue to rise - and child mortality are also significant. Migration also plays an important role in regional distribution .
According to WHO, the average age of the world population was 27.6 years in 2004 and, according to UN data, is expected to rise to 38.1 years by 2050. By 2050, the UN expects a worldwide increase in the number of over 60-year-olds from a good 10% to almost 22% with a simultaneous decline in the proportion of children up to 15 years of age from almost 30% to just under 20%.
Mathematical approximation
In 1975, Sebastian von Hoerner proposed a population growth formula that represented hyperbolic growth with an infinite population in 2025. The hyperbolic growth of the world population observed until the 1970s was later correlated with a non-linear positive feedback of the second order between demographic growth and technological development.
This feedback can be described as follows: technological progress → increasing the carrying capacity of land for people → demographic growth → more people → more potential inventors → accelerating technological progress → accelerated growth in carrying capacity → faster population growth → accelerated growth in the number of potential inventors → faster technological progress → thus faster growth of the earth's carrying capacity for people, etc. The transition from hyperbolic growth to slower growth rates is related to the demographic transition.
According to the Russian demographer Sergej Kapiza , the world population grew between 67,000 BC. Chr. And 1965 according to the following formula:
- N is the current population
- T is the current year
- C = (1.86 ± 0.01) · 10 11
- T 0 = 2007 ± 1
- = 42 ± 1
The world population by continent
| 2016 | 2030 | 2050 | |
|---|---|---|---|
| Asia | 4437 | 4946 | 5327 |
| Africa | 1203 | 1681 | 2527 |
| America | 997 | 1117 | 1220 |
| Europe | 740 | 744 | 728 |
| Oceania | 40 | 51 | 66 |
| world | 7418 | 8539 | 9869 |
The following population figures and projections are taken from the DSW data report 2016 of the German Foundation for World Population from September 2016 and correspond to the publication of the Population Reference Bureau: 2016 World Population Data Sheet .
Historical development
400 BC Until today
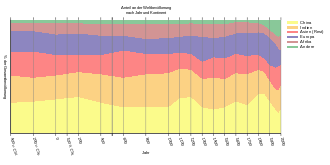
At the turn of the century, around 69% of the world's population lived in Asia (31% in China , 21% in India and around 18% in the rest of Asia), 18% in Europe , 10% in Africa and 3% in America and the rest of the world. These proportions remained largely constant until 1800.
India had its largest percentage of the world population in the early Middle Ages with 30%. During this time, Europe was at a historical minimum of 13%.
China had three maxima around the years 200, 1200, and 1800 with shares over 30%, with periods around 20% in between. The one-child policy in China since the early 1980s has visibly flattened the population growth curve. Currently (2019) the proportion of the world population is around 18%.
The share of North and South America remained low for a long time and around 1700 had a historic low of only 2%. However, it has increased sharply since 1800 and reached the 15% mark in 1975.
Africa fluctuated between 7 and 13%, with its share, having reached an all-time low around 1900, quickly caught up again in the course of the 20th century.
Around 1900 Europe reached its maximum of 24%, since then it has fallen again. At the same time, India was at its historical minimum of 18%.
1950 to 2019
The following diagram shows the development of the population of the world and its continents from 1950 to 2019 in millions

Current status
The information on a world population of 7418 million people is taken from the DSW data report 2016 of the German Foundation for World Population from September 2016 and corresponds to the publication of the Population Reference Bureau: 2016 World Population Data Sheet.
- World: 7,418 million in 2016
Adjacent maps and tables:
- Share of the continents in the world population
- The world population 2011
- Population of the four largest states in 2011
- Population table 2011
offer a complete overview of the distribution of a world population of exactly seven billion people among the 206 states in the list of states in the world (at the end of 2011):
- Map: Share of the continents in the world population - contains a color-coded overview of the population distribution on the continents, with each field representing one percent of the world population.
- Map: The world population 2011 - includes the 136 larger states, each with more than 0.05% of the world population. 99.2% of the world's population live in these 136 of the 206 states.
- Map: States population 2011 - includes the regions of the four largest states (China, India, USA, Indonesia) with a total of 45.0% of the world population, as well as a list of the 70 smaller states with a total of 0.8% of the world population.
- Map: Population table 2011 - contains the population of the continents and the 206 states at the time when seven billion people lived in the world.
• Sources of the population figures on the adjacent maps: DSW data report 2011 from the German Foundation for World Population from September 2011 (partially rounded to the nearest million), as well as the census results in China, India, USA and Indonesia in 2010 and 2011 (rounded to align with the Population figures of the DSW data report 2011)
The most populous states
The information is taken from the DSW data report 2019 of the German Foundation for World Population from November 2019 and corresponds to the publication of the Population Reference Bureau: 2019 World Population Data Sheet.
-
 People's Republic of China : 1,398 million (about 18.2% of the world population)
 -
 India : 1,392 million (18.1%)
 -
 United States : 329 million (5.1%)
 -
 Indonesia : 268 million (3.7%)
 -
 Pakistan : 217 million (2.8%)
 -
 Brazil : 209 million (2.7%)
 -
 Nigeria : 201 million (2.6%)
 -
 Bangladesh : 164 million (2.1%)
 -
 Russia : 147 million (1.9%)
 -
 Mexico : 127 million (1.7%)
 -
 Japan : 126 million (1.7%)
 -
 Ethiopia : 112 million (1.5%)
 -
 Philippines : 108 million (1.4%)
 -
 Egypt : 99 million (1.3%)
 -
 Vietnam : 96 million (1.2%)
 -
 Germany : 83 million (1.1%)
These 16 most populous countries are home to 5.076 billion people and thus around two thirds of the total world population of 7.691 billion. The European Union would take 446 million people (about 5.8% of world population) in 27 Member States (after the United Kingdom and Gibraltar European Union membership referendum) 3rd place. China, India, the EU and the USA together make up almost half of the world's population. In addition to the respective demographics, the respective population development is sometimes strongly influenced by migration (see list of countries by net migration rate ).
Population density and urbanization
| area | Population density 2015 |
|---|---|
| World as a whole | 54 |
| India | 400 |
| Germany | 230 |
| Switzerland | 200 |
| People's Republic of China | 144 |
| European Union | 116 |
| Austria | 110 |
| Africa | 40 |
| United States | 34 |
| South America | 24 |
| Russia | 8th |
| Canada | 4th |
| Australia | 3 |
| Mongolia | 2 |
The population density of the world is extremely different from region to region. The city-states of Monaco with around 19,000, Singapore with almost 8,000 and Vatican City with 1,900 inhabitants per square kilometer have the highest population density of a state . The largest population density of an area State has Bangladesh with about 1,100 inhabitants per square kilometer. Germany has 230, Switzerland 200 and Austria around 110 inhabitants per square kilometer. Of the German federal states, Berlin is the most densely populated with around 3,900 inhabitants per square kilometer. In the case of the federal states, it is North Rhine-Westphalia with 520 inhabitants per square kilometer. The state with the lowest population density is Mongolia with only about 2 inhabitants per square kilometer. The average population density of the earth is around 54 inhabitants per square kilometer of land area (excluding Antarctica).
The UN expects a further increase in global urbanization in the future . In 2007, for the first time in history, more people lived in cities than in rural areas. The proportion of the urban population is expected to rise to over 60% by 2030 and reach around 70% in 2050. In 1950 it was still 30%, the proportion of the rural population consequently 70%. In absolute numbers, this means that the urban population will double between 2005 and 2050 from a good three to a good six billion people. In the same forecast from 2007, however, the UN expects that the absolute number of people living in rural areas will be almost constant between 2010 and 2025 and then fall.
Age and gender structure
Population pyramid
In addition to the general population growth, the increase in life expectancy can clearly be seen in the population pyramids. This can be seen in the change from the widened pyramid shape to a more pronounced beehive shape from the middle of the 21st century.
Gender structure
Although the gender ratio at birth is 1.05 male to 1 female, in 2018 it was only 1.01 to 1 for the total population of the world. This is mainly due to the lower life expectancy of men. For this reason there is a slight surplus of women almost everywhere in the Western world . The surplus of women is particularly strong in Russia due to the significantly below average life expectancy of Russian men, especially in the past. Striking is the high surplus of men in the People's Republic of China which female with frequent abortions body fruits as a result of child policy A- related. The surplus of men is even greater due to the large number of male guest workers in the countries of the Arabian Peninsula .
Number of all humans ever born
The seven billion people living in 2011 were over six percent of the 110 billion modern humans ever born at the time ; over 100 billion had thus died in the past including the Stone Age. There are various sources for calculating the number of people ever born, for example an article by the Population Reference Bureau from the year 2002 with around 106 billion modern humans ever born.
This extrapolation begins with two people in the year 50,000 BC. BC, whereas today it is assumed that the incarnation led to the emergence of modern man 200,000 years ago or earlier. However, early humans play only a minor role in the total. Despite the long period of time, the low life expectancy and the correspondingly high birth rates , the 42,000 years up to the beginning of sedentarism around 10,000 years ago only account for around one percent of the total, while more than half can be attributed to the last 2,000 years alone.
Other species of the genus Homo that lived up to about 2.5 million years ago are not included in this projection. In the case of Neanderthals , it is sometimes assumed that at times only a few thousand lived at the same time.
Another extrapolation comes from the Mathematics Department of the University of Hawaii in 1999 and started a million years ago with two people. Using a similar method, it comes to a total of about 96 billion people. Although the total population is estimated to be much higher at the beginning of settling down, here too, around 20 billion people, only a clear minority falls before 8000 BC. However, it is assumed that the life expectancy will remain constant over the entire period of 25 years.
Both projections assume constant population growth for the entire early period , which, based on the framework assumptions, is only 0.035 or 0.0015 percent per year (corresponds to a doubling of the population within approximately 2,000 or 45,000 years).
World Population Day
On July 11, 1987, the world population exceeded five billion people according to UN calculations. To draw attention to the problems involved, July 11th of each year has been declared International World Population Day since 1989 .
According to UN calculations, the six billionth person on earth was born on October 12, 1999; on October 31, 2011 the seven billionth person.
See also
- Age structure or age pyramid
- Overpopulation
- Load-bearing capacity (ecology)
- List of countries by population growth rate
- List of states and territories by population development
- List of sub-state administrative units by number of inhabitants
literature
- Marc Frey: Experts, Foundations and Politics. On the genesis of the global discourse on population since 1945. In: Zeithistorische Forschungen / Studies in Contemporary History 4 (2007), pp. 137–159.
Web links
- United Nations :
-
German Foundation for World Population :
- Country database - population figures and projections of all countries and regions in the world
- Different graphics for population development
- The world population clock - the estimated current world population
- worldometers.info - Estimated current population growth figures, with data on births and deaths
- Berlin Institute for Population and Development
- US Bureau of the Census (English)
- CIA World Fact Book (English)
- pdwb.de - Proportions of the world population (website of D. Kemmer with links to further sources)
- Wittgenstein Center - The Austrian Wittgenstein Center submits a calculation that differs from the UNO. The researchers led by Prof. Wolfgang Lutz expect 9.5 billion people in 2050. A downward trend is forecast in the years thereafter. Quoted from: “In search of the summit” , Wissen aktuell, ORF, September 8, 2015
Individual evidence
- ↑ Current world population on countrymeters.info , accessed on May 14, 2020.
- ^ A b Population Division of the Department of Economic and Social Affairs of the United Nations Secretariat (Ed.): World Population Prospects. The 2010 revision. World population change per year (thousands) Medium variant 1950–2050 . 2012.
- ↑ population.un.org
- ↑ UNFPA World Population Report 2011 ( Memento from November 6, 2012 in the Internet Archive ), website of the German Foundation for World Population
- ↑ Population growth UN selects seven billionth people. In: Spiegel Online. October 30, 2011, accessed January 7, 2018.
- ↑ a b How many people are you? In: World Population Calculator. German Foundation for World Population , accessed on September 14, 2019 .
- ↑ Population development: data, facts, trends on demographic change. (PDF) (No longer available online.) Federal Institute for Population Research (BiB), 2016, archived from the original on March 25, 2018 ; accessed on April 5, 2018 . Section “Development of the world population by age group, 1950 to 2015”, p. 77.
- ↑ a b Population ages 0-14, total - 2019 revision. World Bank, accessed September 24, 2019 .
- ↑ Population ages 0-14 (% of total), total - 2019 revision. World Bank, accessed September 24, 2019 .
- ↑ Population growth and population growth by region. In: Facts and Figures: Globalization. Federal Agency for Civic Education / bpb.
- ↑ William J. Ripple, Christopher Wolf, Thomas M. Newsome, Mauro Galetti, Mohammed Alamgir, Eileen Crist, Mahmoud I. Mahmoud, William F. Laurance and 15,364 life scientists from 184 countries: World Scientists' Warning to Humanity: A Second Notice . In: BioScience . tape 67 , no. 12 , 2017, p. 1026-1028 , doi : 10.1093 / biosci / bix125 .
- ^ Rudolf Eppler: Technical progress. Volume 3: A study on special environmental problems of technical progress . Duncker & Humblot, Berlin 1978, p. 109; Gregory Fuller : The end. About the cheerful hopelessness in the face of the ecological catastrophe. Meiner, Hamburg 2017, p. 24.
- ↑ UN forecast
- ↑ World Population Prospects 2019: Key Findings. (PDF) United Nations | Department of Economic and Social Affairs | Population Division, accessed April 23, 2020 .
- ↑ Fertility, mortality, migration, and population scenarios for 195 countries and territories from 2017 to 2100: a forecasting analysis for the Global Burden of Disease Study
- ↑ UNESCO information, quoted from: Werner Mohrig: How many people does the earth carry? Urania-Verlag, Leipzig / Jena / Berlin 1976, p. 10.
- ↑ a b Population projections up to 2100 ( Memento from March 19, 2017 in the Internet Archive )
- ↑ S. von Hoerner: Population explosion and interstellar expansion. In: JBIS . tape 28 , 1975, ISSN 0007-084X , pp. 691-712 ( online [accessed April 17, 2020]).
- ↑ A. Korotayev, A. Malkov, D. Khaltourina: Introduction to Social Macro Dynamics . Secular Cycles and Millennial Trends . Ed .: Scientific Literature and Textbooks . 2006, ISBN 5-484-00559-0 (English).
- ^ The phenomenological theory of world population growth. May 11, 2009, accessed April 17, 2020 .
- ↑ a b c d e f g Colin McEvedy, Richard Jones: Atlas of World Population History. Facts on File, Penguin Books, New York 1978, pp. 342-351, cited on worldhistorysite.com
- ↑ a b Data report of the German Foundation for World Population (DSW) 2016
- ↑ a b 2016 World Population Data Sheet. Toshiko Kaneda, Population Reference Bureau, August 24, 2016, accessed January 24, 2019.
- ↑ United Nations, Department of Economic and Social Affairs: World Population Prospects: The 2010 Revision. Data available online
- ↑ DSW data report 2016
- ^ UN World Urbanization Prospects The 2007 Revision
- ↑ How Many People Have Ever Lived on Earth? ( Memento from April 24, 2013 in the Internet Archive )
- ↑ How many people have ever lived? University of Hawaii
- ↑ World population - 6,000,000,000 people. In: spiegel.de , October 12, 1999, accessed on January 7, 2018.
- ↑ Sadiah Meiselbach: The seven billionth person is born - and the public should know about it. In: dsw.org , August 24, 2016, accessed January 7, 2018.
