Grading curve
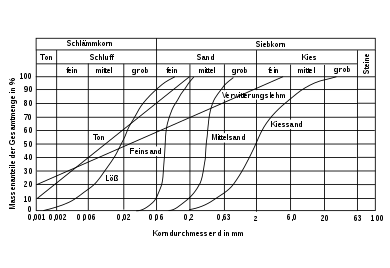
The particle size distribution curve is a passage or cumulative curve , by means of which the grain size distribution of the soil , sediment or sedimentary rock is often represented graphically. It is determined by a sieve analysis , that is by sieving the sample, sieves with successively decreasing mesh sizes are used and each mesh size corresponds to a certain grain size. The smallest grain sizes ( silt and clay ) are "separated" by sludge instead of sieving .
Areas of application
- Construction industry for the economic production of concrete or mortar,
- Soil science , to classify a soil type according to grain size,
- Nursery to mix an ideal growth substrate,
- Hydrogeology and engineering geology , in order to estimate the water permeability of a soil or rock,
- Sedimentology to classify a sediment or sedimentary rock according to grain size and to be able to reconstruct its deposition conditions.
Structure of the grading curve diagram

The grain sizes are plotted on the horizontal, logarithmically scaled axis ( abscissa or x- axis ) of a grading line diagram, and the percentage of the respective sieving passes on the vertical axis ( ordinate or y- axis ) (in English-speaking countries the axes are reversed). The percentage that a certain grain size has in a certain sample is also known as the grain fraction . The grading curve is a cumulative curve , that is, it represents the grain size distribution cumulatively (summed up). It therefore always runs from the bottom left to the top right.
Properties and conclusions about the sample
General
The shape of a grading curve can be expressed numerically by the irregularity number C U and the curvature number C C. “Broad” grading curve curves with a slight increase (C U > 6, C C between 1 and 3) show that the sample has a relatively broad grain size spectrum, that is, it contains many different grain fractions and these in approximately equal proportions. In such cases one speaks of a broadly graded material, in sedimentology and soil science also of a poor grain sorting . “Tight” grading curves with at least some sections showing a very steep rise show that the sample has a relatively narrow grain size spectrum, that is, it contains only a few and moreover very similar grain fractions or these are at least strongly predominant. In such cases one speaks of a closely graded material, in sedimentology and soil science also of a good grain sorting .
The number of deformities and curvatures of a sample are also parameters for determining the water permeability (permeability) of the soil or rock from which the sample originates, e.g. B. after Hazen or Beyer, as well as for the filter rule after Terzaghi . The so-called effective grain diameter d 10 , the grain size at which the sieve curve intersects the 10 percent mark, is a good indicator for permeability .
Ideal grading lines, Fuller's parabola
The grain distribution, which goes back to investigations by W. B. Fuller and S. E. Thompson at the beginning of the 20th century on optimal grain compositions, can be described by:
With:
- Mass fraction with grain diameter smaller than , based on the total mass,
- Maximum grain diameter of the grain mixture,
- Grain diameter ,
- Grain exponent.
The ideal grading line with , which was viewed by Fuller and Thompson as a favorable grain distribution, is called the Fuller's parabola . With this grain distribution, the void content is relatively low, the result is a grain mix with the lowest void space .
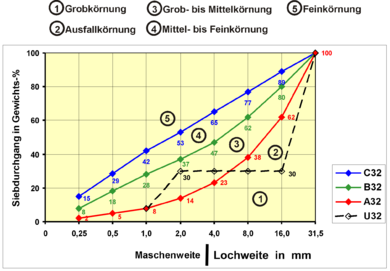
Grain mixtures are also used in concrete production . According to DIN 1045-2, the grading curves A , B and C are differentiated. These ideal grading lines for are shown in the graphic .
Failure grain

The grading curve no. 2 in the adjacent graphic represents a sample with failure grain size. This means that one or more grain sizes between the largest and the smallest grain size are not present in the sample. This gives the grading curve a discontinuous course, as the curve runs horizontally in the area of the missing grain fractions. One speaks here of an intermittent gradation. Such a sample could be a specially compiled building material mixture in which certain grain sizes were deliberately left out so that the building material produced with it has the highest possible pore volume, for example lightweight concrete or open-pored asphalt .
German grading curve standard form
With the German grading curve standard forms, the proportion of fine grain size is usually entered at the bottom left, the proportion of coarse elements is to be entered at the top right.
Individual evidence
- ^ A b Dieter D. Genske: Engineering Geology - Basics and Application. 2nd edition, Springer Spectrum, 2014, ISBN 978-3-642-55387-5 , pp. 199 ff.
- ↑ Hans-Peter Blume, Gerhard W. Brümmer, Rainer Horn, Ellen Kandeler, Ingrid Kögel-Knabner, Ruben Kretzschmar, Karl Stahr, Berndt-Michael Wilke, Sören Thiele-Bruhn, Gerhard Welp: Scheffer / Schachtschabel. Textbook of soil science. 16th edition, Spektrum Akademischer Verlag, Heidelberg / Berlin 2010, ISBN 978-3-8274-1444-1 , p. 173 f.
- ↑ Hans Füchtbauer: Sandstones. P. 97-184 in Hans Füchtbauer (Ed.): Sediments und Sedimentgesteine. 4th, completely revised edition. Schweizerbart, Stuttgart 1988, ISBN 3-510-65138-3 , p. 129 ff.
- ^ Allen Hazen: Experiments on the purification of sewage at the Lawrence Experimental Station. 24th Annual Report to the State Board of Health, Commonwealth of Massachusetts, Public Document 34, Write and Potter Printing Co., 1894, pp. 393-555
- ↑ W. Beyer: To determine the water permeability of gravel and sand from the grain distribution curve. Water management and technology. Vol. 14, No. 6, 1964, pp. 165-168.
- ↑ Lars Meyer: On the influence of the contact zone when modeling the modulus of elasticity of concrete , dissertation, Aachen 2007, p. 102 f. ( PDF )


