List of the largest iron ore producers

from Wikipedia, the free encyclopedia
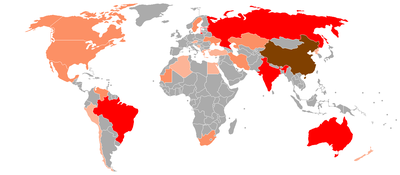
Countries with iron ore production

The list of the largest iron ore producers contains tables and graphics with precise information on the subject of iron ore .

overview

In 2011, the People's Republic of China (1.2 billion tons), Australia (480 million tons) and Brazil (390 million tons) were the three most important producing countries for iron ore, which together accounted for 73.9 percent of the 2, 8 billion tons . Important mining areas in Europe are in Russia , Ukraine and Sweden .

The economically minable reserves were estimated by the United States Geological Survey (USGS) in 2011 at 170 billion tons worldwide. If production remained the same, iron ore could still be extracted for about 61 years. The largest stocks are in Australia (20.6%), Brazil (17.1%) and Russia (14.7%). Large parts of the Australian production are exported to China. In the Amazon rainforest of Brazil, in the Serra dos Carajás, is the largest iron ore deposit in the world with an estimated 17 billion tons of strip iron ore, which is extracted in a huge open pit.

In the non-European countries, but also in Russia and the Ukraine, predominantly higher-quality ores are mined and offered more cheaply than by producers in the European Union . As a result, almost all of the former producing countries in the EU, for example Luxembourg (1982), Great Britain (1993), Spain (1997) and France (2003), stopped their production or, as in Germany, reduced it considerably. In Liberia , too , which was one of the largest producing countries in the world until the outbreak of civil war in 1989, mining ceased in 1993.

Demand has increased sharply since the beginning of the 21st century, as the People's Republic of China, several countries in East Asia and the USA increased their steel production. The resulting shortage on the raw material market (ore, steel scrap) led to an increase in world market prices.

Production, reserves and stock base

The United States Geological Survey offers the following definition of this: The reserve base is that part of an identified resource that meets the specific minimum physical and chemical criteria for current mining and production practices, including those for grade , Quality , thickness and depth . The reserves are that part of the supply base that could be economically extracted or produced at a given time. The term does not have to mean that extraction systems are installed and working. Reserves only contain exploitable substances.

The countries with the highest production and the highest reserves are listed in millions of tons. The publication of data on the stock base was discontinued in 2009.

Figures in million tons (2011)
rank country Mining
(iron ore)
Reserves
(raw ore)
Reserves
(iron content)
1. China People's RepublicPeople's Republic of China People's Republic of China 1,200 23,000 7,200
2. AustraliaAustralia Australia 480 35,000 17,000
3. BrazilBrazil Brazil 390 29,000 16,000
4th IndiaIndia India 240 7,000 4,500
5. RussiaRussia Russia 100 25,000 14,000
6th UkraineUkraine Ukraine 80 6,000 2,100
7th South AfricaSouth Africa South Africa 55 1,000 650
8th. United StatesUnited States United States 54 6,900 2,100
9. CanadaCanada Canada 37 6,300 2,300
10. IranIran Iran 30th 2,500 1,400
11. SwedenSweden Sweden 25th 3,500 2,200
12. KazakhstanKazakhstan Kazakhstan 24 3,000 1,000
13. VenezuelaVenezuela Venezuela 16 4,000 2,400
14th MexicoMexico Mexico 14th 700 400
15th MauritaniaMauritania Mauritania 11 1,100 700
Other countries 50 12,000 6,000
world 2,800 170,000 80,000

advancement

By country

All figures relate to the states within their current borders.

Production in thousands of tons of gross weight
Rank
(2016)
country 1970 1980 1990 2000 2007 2008 2009 2010 2016
1. China People's RepublicPeople's Republic of China People's Republic of China 43,690 112,580 179,344 223,950 707.073 824.011 880.171 1,071,555 1,280,893
2. AustraliaAustralia Australia 51.189 99.160 109.166 176,300 299.038 342,435 394.069 433,452 858.025
3. BrazilBrazil Brazil 36,381 113.024 152.302 208,830 354,674 351.200 331,000 372,300 424.200
4th IndiaIndia India 31,366 40,682 53,702 80,762 213.246 212.960 218,639 208.111 192.081
5. RussiaRussia Russia 91,451 114,477 110.494 86,630 104,953 99.272 92,050 99.060 101,000
6th UkraineUkraine Ukraine 84,316 105,545 81,315 55,883 77,930 72,688 66,452 78,541 66,900
7th South AfricaSouth Africa South Africa 9,192 25,738 30.291 33,707 42.101 48,983 55,313 58,709 66,456
8th. CanadaCanada Canada 47,458 48,753 36,688 36,740 33,158 32.102 31,669 37.001 48,990
9. IranIran Iran 10 590 2,611 12.208 35.195 38,200 34,034 34,500 48,000
10. United StatesUnited States United States 91,534 70,727 55,458 63,089 52,500 53,600 26,700 49,500 40,800
11. KazakhstanKazakhstan Kazakhstan 19,275 24,129 23,289 16,157 19,582 21,486 46,248 50,190 35,417
12. SwedenSweden Sweden 31,518 27,174 19,877 20,557 24,714 23,888 17,677 25,292 31,843
13. MexicoMexico Mexico 4,812 8,149 9,209 11,326 16,540 17,709 17,693 21,210 20,400
14th MauritaniaMauritania Mauritania 9,103 8,936 11,416 11,069 11,815 10,968 10,275 11,109 13,268
15th ChileChile Chile 11,265 8,960 7,800 8,729 8,818 9,316 8,242 9.130 14,619
16. VenezuelaVenezuela Venezuela 22,070 13,681 20,240 17,353 19,632 19,332 14,207 14,331 11,000
17th TurkeyTurkey Turkey 2,671 2,707 6,155 4,076 4,550 3,990 4,170 5,188 7,800
18th PeruPeru Peru 12,585 5,870 3,307 4.143 6.277 6,348 5,435 6,348 7,663
19th Sierra LeoneSierra Leone Sierra Leone 6,576
20th IndonesiaIndonesia Indonesia 3,800
21st New ZealandNew Zealand New Zealand 142 3,160 2,298 2,692 1,724 2,020 2,093 2,439 3,496
22nd VietnamVietnam Vietnam 0 0 0 300 1,200 1,200 1,800 1,900 3,154
23. AustriaAustria Austria 3,997 3,200 2,301 1,859 2.153 2,033 2.002 2,069 2,777
24. MongoliaMongolia Mongolia 0 0 0 0 265 1,387 1,379 3,203 2.210
25th Korea NorthNorth Korea North Korea 8,000 8,200 9,500 5,000 5.126 5,316 4,955 5,000 2,000
26th MalaysiaMalaysia Malaysia 4,491 372 348 259 802 982 1,470 3,466 1.914
27. NorwayNorway Norway 4,008 3,883 2,081 470 630 746 896 3,105 1,758
28. Bosnia and HerzegovinaBosnia and Herzegovina Bosnia and Herzegovina 1,880 2,286 2,100 363 2,944 2,667 2,727 1,401 1,752
29 LiberiaLiberia Liberia 22,294 18,250 3,981 0 0 0 0 0 1,522
30th EgyptEgypt Egypt 451 1,865 2,432 2,500 2,185 1,811 1,780 1,800 1,500
31. AlgeriaAlgeria Algeria 2,863 3,454 2,930 1,645 1,982 2,077 1,307 1,474 945
32. ColombiaColombia Colombia 716
33. GermanyGermany Germany 5,953 1999 168 462 422 455 364 390 514
34. Korea SouthSouth Korea South Korea 635 619 298 163 291 366 455 513 454
35. PakistanPakistan Pakistan 0 0 0 0 126 286 320 402 432
ThailandThailand Thailand 23 84 132 100 1,555 1,710 616 977 0
AngolaAngola Angola 6.091 0 0 0 0 0 0 0 0
FranceFrance France 56,805 29,200 8,726 31 0 0 0 0 0
United KingdomUnited Kingdom United Kingdom 12,018 916 53 1 0 0 0 0 0
LuxembourgLuxembourg Luxembourg 5,722 605 0 0 0 0 0 0 0
SpainSpain Spain 7,051 9.227 3,030 75 0 0 0 0 0

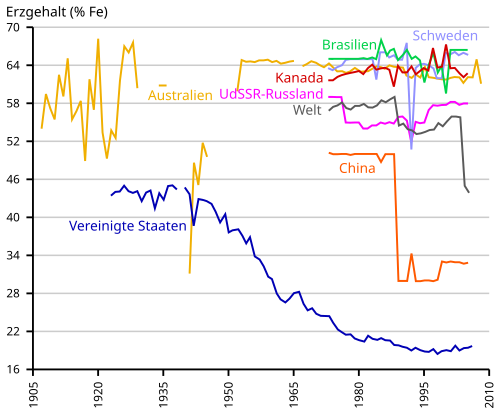
According to ore grade

The average iron content of the mined ores continues to decrease.

The three leading producing countries

Production in thousands of tons of gross weight
year 1. Prod. 2. Prod. 3. Prod.
1950 United StatesUnited States 98.040 Soviet UnionSoviet Union 39,651 FranceFrance 29,988
1951 United StatesUnited States 119,484 Soviet UnionSoviet Union 44,879 FranceFrance 35.203
1952 United StatesUnited States 100,405 Soviet UnionSoviet Union 52,560 FranceFrance 40,801
1953 United StatesUnited States 119,892 Soviet UnionSoviet Union 59,642 FranceFrance 42,444
1954 United StatesUnited States 79,380 Soviet UnionSoviet Union 64,316 FranceFrance 43,812
1955 United StatesUnited States 104,652 Soviet UnionSoviet Union 71,862 FranceFrance 50,268
1956 United StatesUnited States 99,420 Soviet UnionSoviet Union 78,100 FranceFrance 52,692
1957 United StatesUnited States 107,856 Soviet UnionSoviet Union 84,200 FranceFrance 57,768
1958 Soviet UnionSoviet Union 88,816 United StatesUnited States 69,036 FranceFrance 59,460
1959 Soviet UnionSoviet Union 94.015 FranceFrance 60,900 United StatesUnited States 60,444
1960 Soviet UnionSoviet Union 105,857 United StatesUnited States 89.040 FranceFrance 66,912
1961 Soviet UnionSoviet Union 117,633 United StatesUnited States 72,948 FranceFrance 66,576
1962 Soviet UnionSoviet Union 128.111 United StatesUnited States 73,752 FranceFrance 66,324
1963 Soviet UnionSoviet Union 137,455 United StatesUnited States 73,884 FranceFrance 57,888
1964 Soviet UnionSoviet Union 145.856 United StatesUnited States 85.140 FranceFrance 60,936
1965 Soviet UnionSoviet Union 153,432 United StatesUnited States 88.020 FranceFrance 59,520
1966 Soviet UnionSoviet Union 160.271 United StatesUnited States 91,596 FranceFrance 55.056
1967 Soviet UnionSoviet Union 168.246 United StatesUnited States 84,744 FranceFrance 49,224
1968 Soviet UnionSoviet Union 176,616 United StatesUnited States 86.508 FranceFrance 55,236
1969 Soviet UnionSoviet Union 186.134 United StatesUnited States 89.004 FranceFrance 55,140
1970 Soviet UnionSoviet Union 195.506 United StatesUnited States 91,534 FranceFrance 56,805
1971 Soviet UnionSoviet Union 203.004 United StatesUnited States 82,116 AustraliaAustralia 62,063
1972 Soviet UnionSoviet Union 208.127 United StatesUnited States 76,493 AustraliaAustralia 64,401
1973 Soviet UnionSoviet Union 216.104 United StatesUnited States 88,397 AustraliaAustralia 84,828
1974 Soviet UnionSoviet Union 224,883 AustraliaAustralia 96,950 United StatesUnited States 85,350
1975 Soviet UnionSoviet Union 232.803 AustraliaAustralia 97,651 BrazilBrazil 88,490
1976 Soviet UnionSoviet Union 239.109 AustraliaAustralia 93,255 BrazilBrazil 82,440
1977 Soviet UnionSoviet Union 239.716 AustraliaAustralia 95,923 China People's RepublicPeople's Republic of China 93,840
1978 Soviet UnionSoviet Union 244.231 China People's RepublicPeople's Republic of China 117,790 BrazilBrazil 84,372
1979 Soviet UnionSoviet Union 241,597 China People's RepublicPeople's Republic of China 118,760 BrazilBrazil 95,457
1980 Soviet UnionSoviet Union 244,762 BrazilBrazil 113.024 China People's RepublicPeople's Republic of China 112,580
1981 Soviet UnionSoviet Union 242,416 China People's RepublicPeople's Republic of China 104,590 BrazilBrazil 97,850
1982 Soviet UnionSoviet Union 244.410 China People's RepublicPeople's Republic of China 107,320 BrazilBrazil 93,147
1983 Soviet UnionSoviet Union 245.189 China People's RepublicPeople's Republic of China 113,660 BrazilBrazil 88,695
1984 Soviet UnionSoviet Union 247.104 China People's RepublicPeople's Republic of China 126.710 BrazilBrazil 111,311
1985 Soviet UnionSoviet Union 247,700 China People's RepublicPeople's Republic of China 137,835 BrazilBrazil 128,200
1986 Soviet UnionSoviet Union 249.976 China People's RepublicPeople's Republic of China 149,450 BrazilBrazil 129,500
1987 Soviet UnionSoviet Union 250,900 China People's RepublicPeople's Republic of China 161,430 BrazilBrazil 134,700
1988 Soviet UnionSoviet Union 249,737 China People's RepublicPeople's Republic of China 167,700 BrazilBrazil 145.040
1989 Soviet UnionSoviet Union 241,348 China People's RepublicPeople's Republic of China 171,854 BrazilBrazil 153,740
year 1. Prod. 2. Prod. 3. Prod.
1990 Soviet UnionSoviet Union 236.200 China People's RepublicPeople's Republic of China 179,344 BrazilBrazil 152.302
1991 Soviet UnionSoviet Union 198,862 China People's RepublicPeople's Republic of China 190,558 BrazilBrazil 150,657
1992 China People's RepublicPeople's Republic of China 209,762 BrazilBrazil 145.820 AustraliaAustralia 113.097
1993 China People's RepublicPeople's Republic of China 226.352 BrazilBrazil 149.970 AustraliaAustralia 121,429
1994 China People's RepublicPeople's Republic of China 250,696 BrazilBrazil 167.810 AustraliaAustralia 128,662
1995 China People's RepublicPeople's Republic of China 261,919 BrazilBrazil 178,380 AustraliaAustralia 139,067
1996 China People's RepublicPeople's Republic of China 252.283 BrazilBrazil 179,870 AustraliaAustralia 147,200
1997 China People's RepublicPeople's Republic of China 268,612 BrazilBrazil 187,950 AustraliaAustralia 157.766
1998 China People's RepublicPeople's Republic of China 246,890 BrazilBrazil 183,050 AustraliaAustralia 155.731
1999 China People's RepublicPeople's Republic of China 237.230 BrazilBrazil 188,740 AustraliaAustralia 154.268
2000 China People's RepublicPeople's Republic of China 223,950 BrazilBrazil 212,576 AustraliaAustralia 167.935
2001 China People's RepublicPeople's Republic of China 218,300 BrazilBrazil 201,430 AustraliaAustralia 181.140
2002 China People's RepublicPeople's Republic of China 231,400 BrazilBrazil 214,560 AustraliaAustralia 187.210
2003 China People's RepublicPeople's Republic of China 261.085 BrazilBrazil 230,707 AustraliaAustralia 211.997
2004 China People's RepublicPeople's Republic of China 310.104 BrazilBrazil 270,522 AustraliaAustralia 234,697
2005 China People's RepublicPeople's Republic of China 426.232 BrazilBrazil 292,400 AustraliaAustralia 257,525
2006 China People's RepublicPeople's Republic of China 588.171 BrazilBrazil 318,629 AustraliaAustralia 275.091
2007 China People's RepublicPeople's Republic of China 707.073 BrazilBrazil 354,674 AustraliaAustralia 299.038
2008 China People's RepublicPeople's Republic of China 824.011 BrazilBrazil 351.200 AustraliaAustralia 342,435
2009 China People's RepublicPeople's Republic of China 880.171 AustraliaAustralia 394.069 BrazilBrazil 331,000
2010 China People's RepublicPeople's Republic of China 1,071,555 AustraliaAustralia 433,452 BrazilBrazil 372,300

World funding

The following table shows the world production of iron ore in millions of tons.

Production in millions of tons
year Prod.
1904 96
1905 116
1906 100
1907 135
1908 109
1909 126
1910 142
1911 133
1912 151
1913 177
1914 118
1915 116
1916 139
1917 142
1918 127
year Prod.
1919 110
1920 124
1921 73
1922 104
1923 136
1924 130
1925 151
1926 155
1927 171
1928 174
1929 201
1930 179
1931 119
1932 76
1933 91
year Prod.
1934 120
1935 138
1936 170
1937 212
1938 162
1939 204
1940 204
1941 220
1942 235
1943 231
1944 203
1945 162
1946 154
1947 187
1948 219
year Prod.
1949 223
1950 251
1951 294
1952 297
1953 338
1954 405
1955 369
1956 395
1957 434
1958 405
1959 439
1960 522
1961 503
1962 508
1963 523
year Prod.
1964 583
1965 621
1966 636
1967 623
1968 679
1969 713
1970 769
1971 787
1972 778
1973 846
1974 898
1975 902
1976 899
1977 841
1978 847
year Prod.
1979 903
1980 891
1981 858
1982 781
1983 740
1984 829
1985 861
1986 864
1987 903
1988 967
1989 1010
1990 983
1991 956
1992 925
1993 953
year Prod.
1994 992
1995 1030
1996 1020
1997 1070
1998 1050
1999 1020
2000 1070
2001 1040
2002 1100
2003 1210
2004 1360
2005 1550
2006 1840
2007 2040
2008 2210
year Prod.
2009 2240
2010 2590
2011 2800
2012 2972
2013 3181
2014 3386
2015 3300
2016 3305

See also

literature

  • Fischer-Taschenbuch-Verlag: Fischer-Weltalmanach. Figures-data-facts , 1960 ff.

Web links

Individual evidence

  1. Handelsblatt: John F. Jungclaussen: The secret methods of the raw materials industry. , dated February 7, 2012
  2. Focus: Brazil - New Momentum , from December 1, 2010
  3. United States Geological Survey: World Mine Production and Reserves (PDF; 29 kB)
  4. ^ A b British Geological Survey: World mineral statistics archive
  5. World Steel Association: Statistics archive ( Memento of the original from February 12, 2012 in the Internet Archive ) Info: The archive link was inserted automatically and has not yet been checked. Please check the original and archive link according to the instructions and then remove this notice. @1@ 2Template: Webachiv / IABot / www.worldsteel.org
  6. United States Geological Survey: World Production (PDF; 298 kB)