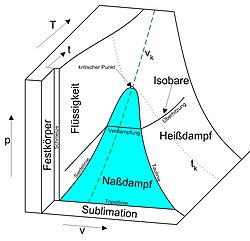
pvT diagram
A PVT diagram is in the physical chemistry and in thermodynamics , the three-dimensional representation of the states of a thermodynamic system with the state variables pressure p , specific volume v and temperature T . From such a state diagram , the thermodynamic state of equilibrium of the system can be read qualitatively under given conditions. If the system can exist in different aggregate states, the diagram shows their respective areas of existence. In this context, the diagram is also referred to as a phase diagram .
State diagram
As experience shows, the state of a fluid phase of a pure substance (or a fluid mixture with constant composition) is clearly defined by specifying two independent, intensive state variables and one extensive state variable. The extensive state variable contains the amount of substance in the system under consideration. If its amount is irrelevant, the remaining two intensive state variables are sufficient to clearly define the state of the system. For example, the measurable variables specific volume v and temperature T can be selected for this. A point on the state surface to which a specific pressure belongs is then clearly assigned to this value pair. The associated specific volume also results from the selection of a value pair for pressure and temperature.
This three-dimensional diagram offers a clear representation of the different states, but is unsuitable for tapping concrete data.
The projections of this diagram in the three levels (pv-level, pT-level and Tv-level) are, however, frequently used work diagrams, since the values can be read from the coordinates. The best known is the pv diagram .
Depending on requirements, the extensive variable V is also used instead of the intensive variable v, for example for the process in a piston engine with certain cylinder dimensions.
Phase diagram

Since, as shown in the two figures, usually the state behavior of substances or mixtures in all three phases is represented ( states of aggregation "solid", "liquid" and "gaseous"), are the pvT -diagram and its projections as phase diagrams referred.
Such a phase diagram typically contains
- Areas in which only one phase exists, i.e. in which the entire system is solid or liquid, for example.
- Areas in which two different phases occur together, i.e. in which the system is half-melted, for example. The pressure shown in the diagram is then the equilibrium pressure common to both phases, for example the vapor pressure in a system that consists of a liquid and a gas phase. Both phases also have the same temperature.
- an area ( triple line ) in which all three phases can coexist together. The three phases have the same pressure and temperature (for water 0.01 ° C and 611.657 ± 0.010 Pa).
The critical point is the condition at which the boiling line and dew line converge. With isobaric heat supply at critical pressure (221.2 bar for water) - and above - the liquid phase changes into the gaseous phase without an evaporation process (the isobar does not pass through the wet steam area ).
See also
- The pvT diagram is the graphic representation of the thermal equation of state of the system, which also uses the variables p , v and T for the state description.
Individual evidence
- ^ HD Baehr: Thermodynamics. 12th edition, Springer, Berlin / Heidelberg / New York 2005, ISBN 3-540-23870-0 , p. 20.
Web links
- Video: State diagram of a one-component system - how do you describe a pure substance with numbers? . Jakob Günter Lauth (SciFox) 2013, made available by the Technical Information Library (TIB), doi : 10.5446 / 15646 .
