PT
2 link in the structure diagram
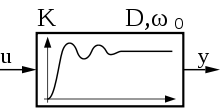
As PT 2 -member a refers LZI - transmission member in the control engineering , which is a proportional having transmission response with a delay of 2nd order. Due to its complex conjugate poles, the PT 2 element (also known as the element) responds to a change in the input signal with an oscillatory damped output signal.

The degree of damping determines the vibration properties of the system with the time behavior. With one degree of damping , the PT 2 link can be broken down into two PT 1 links. With a degree of damping , instability arises with increasing vibration amplitudes.


Linear transmission links capable of oscillation are created by the exchange of energy between its coupled individual elements. If a control loop with a controlled system consists of two elements and a P gain of approx. , A damped oscillating output behavior occurs after an input excitation.


In control engineering, a weak overshoot behavior of a control loop of the order of magnitude of approx. 10% of the setpoint is often desired because the controlled variable reaches the setpoint more quickly.
Differential equation and transfer function
Common examples of a PT 2 link are the RLC oscillating circuit in electrical engineering and the damped spring-mass pendulum in mechanical engineering .
The general form of the associated differential equation with the input variable and the output variable is in the different notations:


-
 .
.
-
 and are the coefficients (weights) of the differential terms.
If the differential equation of a transmission system is transformed into the s-domain (also image domain) using the Laplace differentiation theorem, a linear differential equation with constant coefficients results in the transfer function as a rationally broken function in polynomial representation. It is an important mathematical tool for solving differential equations.

Laplace transform of the above differential equation:
-
 .
.
The transfer function is defined as the ratio of the output signal to the input signal of a system as a function of the complex frequency :


The transfer function is brought into a normal form of the term by dividing all terms by . The term is equated.


This creates the normal form of the transfer function of the vibrational link with the natural angular frequency:


|
or with :


|
Here:
-
 the transfer constant or the gain factor,
-
 the characteristic angular frequency or natural angular frequency and
-
 the dimensionless damping (the degree of damping ). It is also often used for cushioning.
-
 is the independent Laplace variable in the complex frequency domain (image area, s-area) with as real part and as imaginary part . It allows any algebraic operations in the s-domain, but is only a symbol for a completed Laplace transformation and does not contain a numerical value. Exponents of s correspond to the degree of derivative of the differentials .

Determination of the poles
The zeros of the denominator polynomial (= poles) of a transfer function exclusively determine the time behavior of a transfer system.
The poles cause the following global system behavior:
- Pole real,

- The step response of a transmission system of a higher order with only real poles has a global asymptotic system behavior. It contains lots of links.
- Pole conjugated complex . In the s-plane, conjugation is understood as a double pole mirrored around the real axis. In the case of links with vibrating components, the poles are complex conjugate.

- The step response of a higher-order transmission system with only one complex conjugate double pole has a global damped oscillation behavior.
- Pol corresponds to a missing terminating element of the transfer function. coefficient


- The step response of a higher-order transmission system without a terminating element forms the partial transmission function and causes a global, integral system behavior.

If the real parts of zeros and poles are negative, the system is stable. Negative real parts of the poles mean asymptotic stability of the subsystem.
The poles (zeros of the denominator polynomial) can now be determined by setting the denominator polynomial of the transfer function equal to zero.
If numerical values of a transfer function are given in the polynomial representation , the poles for systems of the second order can be determined using various methods, such as the pq formula . Programs up to the 4th order are available on the Internet with the call "Determine zeros (solutions) of polynomials".
For systems with 2nd order polynomials of the form , the zeros or the poles are calculated:

-
 .
.
Determination of the angular frequency of the -link
A distinction is made between damped and undamped transmission systems:
-
 = Characteristic frequency of the undamped transmission system.
-
 = Natural angular frequency of the damped transmission system.
- The natural angular frequency of a damped transmission system and its oscillation amplitudes are always smaller than the characteristic angular frequency and its oscillation amplitudes of the undamped link.
The characteristic frequency can be formed from the coefficient from the normal form of the transfer function of a damped element .


For a given transfer function, the coefficients, as well as each, are numerical values.

The characteristic angular frequency of the damping-free system is determined from the coefficient .

-
 .
.
The attenuation is calculated from the numerical value of the coefficient for .
With increasing damping value, the oscillation frequency and the amplitude of the system response (transition function) decrease. At , the damped oscillation changes into an aperiodic course of the second order or, if it increases further, into a creep case.


The natural angular frequency of the dampened oscillating system is determined by:

The oscillation frequency of the damped system is:


The period of the damped oscillating system is:


Determination of the transfer function of an element from a given graphic representation of the step response
Stable oscillating system

Step response of a PT2 element with conjugate complex poles.

If the step response of this system is given graphically, the transfer function of the -link ( oscillation element ) can be calculated from the amplitude ratio of the first two half-waves.
With the amplitude in the positive direction and with the amplitude in the negative direction of the first oscillation.


First the vibration damping is calculated:

The coefficient is calculated from the period of the 1st oscillation and the damping :


This gives the transfer function with the calculated values of , and to:


Application example for determining the parameters of a -link
|
Given transfer function with denominator polynomial for

Wanted: poles, damping, the natural angular frequency , , period .
 
- Polynomial: ,

-
 , ,
Result: The link cannot be broken down into additional links.
Determination of the damping :
- By comparing factors from the given normal form of the transfer function, the relationship results:
-
 . .
-
 . .
Determination of the damped natural angular frequency after an input jump : 
The undamped characteristic frequency of the step response of the element is:
-
 . .
The damped natural angular frequency of the step response of the -link is:

The oscillation frequency of the damped system is:

The period of the damped oscillation is:

Result: See the period of the graphic! With weak damping, and are similar.
Determination of the transfer function for real poles :
-
Given: transfer function
 -
Wanted: Decomposition into further terms:
- Polynomial:

-
 . .
The polynomial set to zero was divided above by the factor and must be taken into account.

Transfer function in pole representation and time constant representation:

|
Stable, non-oscillating system,
Several methods are available for identifying the time constants and amplifying a non-oscillating system:
- Identification via the impulse response for transmission systems of any order, see article controlled system
- Time percentage characteristic value method (black) after the step response with time values of [percent]. This procedure also applies to non-oscillating transfer elements of a higher order. See article controlled system

- If you have a self-created or commercial computer program for graphical step responses: empirical solution through trial and error.
The following procedure and equations were determined through numerical simulation and optimization of functions.
Method:
- Measurement of the step response of the system with the input step and the step response of the system .
- Determine the times and starting from the point in time of the jump to the point in time when the step response has reached or from the steady-state starting value.


- Find the stationary gain

- Calculate the following intermediate sizes:


- Calculate the two time constants and with


- Representation of the identified transfer function

|
Calculation example for the identification of a transfer function from the step response:
- Read the data from the y (t) diagram

- The equations give:

- Calculated time constants .

|
Note:
By means of an exact numerical calculation (resolution ) of the step response of an element, it was found that the specified target time constants did not exactly match the calculated time constants (deviation approx. 6%), but still produced a useful result.
![{\ displaystyle \ Delta t = 0 {,} 001 \ [s]}](https://wikimedia.org/api/rest_v1/media/math/render/svg/b486775664a719bb84a50a19bf7089dfa01d6da2)


The cause: The result of the calculated time constant is obviously a good approximation of the actual function of the step response. It has been empirically determined that in a range of a maximum of % of the smaller time constant, the relationship between the target time constants and the calculated time constants applies:

-
 Applies to a range of a maximum of % of the smaller time constant .
From this it can be deduced for the graphic shown, for example, that the assumed original transfer function was as follows:
-
 .
.
In the graphical representation of the step responses in a 10 * 10 [cm] diagram, the course of the two functions is practically congruent. The unnecessarily high number of digits (up to 7 digits including decimal places) of the factors (constants) can be limited to 4 digits including decimal places without changing anything in the result of the time constants.
Methods of calculating the time behavior of transmission links
- Solution from the ordinary differential equation up to a maximum of second order (very laborious).
- Solution from the transfer function:
- by decomposing partial fractions into simple additive terms that can easily be transformed into the time domain.
- by using Laplace transform tables which contain the corresponding equations in the time domain.
- Note: If a transmission system contains vibration components, the transformation tables result in complex trigonometric equations.
- Use ready-made commercial programs such as Matlab and Simulink .
- Conversion of ordinary differential equations of a transmission system into difference equations that can easily be solved in a table.
The calculation of the time behavior of an element from the transfer function is usually carried out for normalized input signals . To calculate the step response with the input signal , the term is multiplicatively appended to the transfer function . If the latter is not carried out, the impulse response is obtained instead of the step response.


Calculation of the step response of an element in the time domain
The most important Laplace transformation tables presented in every good technical book on control engineering allow the calculation of the time behavior of a transmission system for a given transmission function .
The correspondence tables contain the associated equations for calculating the output signal in the time domain for the defined forms of the input signals shown below . In order to determine the equation for calculating the time behavior of the transmission system, the given transmission function must be multiplied by the type of input signal.
The following normalized Laplace transformed input signals are:
- Pulse function: .

- Unit step, step function: .

- Slope function .

- Sine function .

To determine the time behavior of a -link, the form of the equation to be searched for in the transformation table is:
-
 .
.
-
 .
.
The Laplace inverse transformation into the time domain with the aid of Laplace transformation tables is carried out with the function sought , multiplied by the desired input signal .
The following applies to the standard jump on the -link:

or

Differentiation of the step response according to the degree of damping 
- For : The system responds with a constant oscillation around the value of the gain . This means that the term in the transfer function disappears and the equation for calculating the time response is simplified.


- The equation for calculating the time response is simplified because the transfer behavior is determined by two terms of the transfer function.
- At are the time constants of the transfer function .

- For there is a complex conjugate double pole with a positive real part. The term becomes negative. The transmission link responds with unstable, increasingly increasing amplitudes.
-
Note: The unstable delay elements, mistakenly unstable -Glieder called, no proportional behavior have. They can be called unstable links .
Time behavior of the step response of a -link as a function of the damping
Depending on the given numerical values of a transfer function G (s), different representations of the system time behavior result.
-
 .
.
- If the numerical values of a transfer function are available in polynomial representation, the 2 poles of the numerator polynomial can be determined. If they are negative and real, the time constants can be calculated.


- If the poles are conjugate complex with a negative real part, the system cannot be broken down into terms. This is a (mirrored) double pole, which causes a damped oscillation in the step response of the system.
- Depending on the numerical values, various forms of the transmission behavior of the system can be represented with and .


Note: The transfer function as a search function in the Laplace transformation tables changes for the degrees of attenuation , and . This also changes the equations for the time domain.

| damping
|
Normalized step response 
|
comment
|
|
Creep fall
|

![{\ displaystyle y (t) = K \ left [1 - {\ frac {T_ {1}} {T_ {1} -T_ {2}}} \ mathrm {e} ^ {- {\ frac {t} { T_ {1}}}} + {\ frac {T_ {2}} {T_ {1} -T_ {2}}} \ mathrm {e} ^ {- {\ frac {t} {T_ {2}}} } \ right]}](https://wikimedia.org/api/rest_v1/media/math/render/svg/7b09a6e0859f9c4ac18b1b9844b744e00ad5770b)
|
The system output does not contain any oscillating components. The asymptotic time course of the step response is determined by two terms with different time constants. The larger time constant dominates the course.
|
|
aperiodic borderline case
|

![{\ displaystyle y (t) = K \ left [1- \ mathrm {e} ^ {- {\ frac {t} {T_ {1}}}} - {\ frac {t} {T_ {1}}} \ mathrm {e} ^ {- {\ frac {t} {T_ {2}}}} \ right]}](https://wikimedia.org/api/rest_v1/media/math/render/svg/9afec034ecd03f93b160732870f3098bb65f2c3a)
|

Illustration 1): T1 = T2 = 2; D = 1
|
stable vibration case |

![{\ displaystyle y (t) = K \ left [1 - {\ frac {1} {\ sqrt {1-D ^ {2}}}} \ cdot \ mathrm {e} ^ {- D \ omega _ {0 } t} \ cdot \ sin (\ omega _ {0} {\ sqrt {1-D ^ {2}}} t + \ arccos D) \ right]}](https://wikimedia.org/api/rest_v1/media/math/render/svg/65697c8101d029d176b0916d4c34a847effb915b) 
The system includes two complex conjugate poles: . |
|
limit stable oscillation case |


The system includes two complex conjugate poles: . |
|

unstable vibration case |


The system includes two complex conjugate poles having a positive real part: . |
|

unstable creep fall
|

![{\ displaystyle y (t) = K \ left [1 - {\ frac {T_ {1}} {T_ {1} -T_ {2}}} \ mathrm {e} ^ {\ frac {t} {T_ { 1}}} + {\ frac {T_ {2}} {T_ {1} -T_ {2}}} \ mathrm {e} ^ {\ frac {t} {T_ {2}}} \ right] \ qquad T_ {1} \ neq T_ {2}}](https://wikimedia.org/api/rest_v1/media/math/render/svg/95f12db829a58bedefe99e22c63e7d14d7afe940)
The system contains 2 real positive poles and can thus be split into 2 unstable T1 terms. 
|

T1 = 10, T2 = 5, D = -1.06, K = 1.
|

Step response of a PT
2 link (K = 2, T = 1, D = 0.2; 1; 5)
Example curves of step responses for different D values: .

The transfer functions of the graphs shown can be determined by comparing factors with the basic shape. T = 1 applies to all courses; K = 2:
- For the -link with the transfer function is:

- For the -link with the transfer function is:


- For the -link with the transfer function is:

- The transfer function for the -link with is (see calculation example for procedure):


- With

Graphical methods of the Bode diagram and the locus to determine the stability
A phase shift of φ <−180 ° and a gain> 1 leads from negative feedback to positive feedback and thus to oscillating instability when the control loop is closed.
From this behavior, the American physicist Harry Nyquist has derived stability criteria that relate to the open control loop and are to be used for the closed condition of the control loop.
The graphic stability method using the Bode diagram and the locus of the frequency response serve to understand sub-areas of system theory, but are not an alternative to the numerical calculation of a control loop, in which the inner sub-system behavior is shown in tabular form for each calculation sequence y (k Δt) and the Time waveform of different output variables for any input variable is shown.
Bode diagram
The PT 2 link is

the frequency response . Therefore, the following applies to the amplitude and phase response in the Bode diagram :


The following figure shows the amplitude and phase response . Typical for a PT 2 element is the decrease in amplitude by 40 dB per decade. The phase shift of 180 ° is also characteristic. The increase in the amplitude response shows that the damping must apply. No elevation means damping .


With the characteristic angular frequency (= corner frequency ) the phase shift has a value of -90 °. With increasing frequencies, the phase shift amounts to a maximum of | -180 | °.


Bode diagram of a PT
2 link (K = 2, T = 1, D = 0.2; 1; 5)
Locus of the frequency response
The frequency response equation of the open circle is resolved according to the real part and the imaginary part and entered in a coordinate system. The vertical axis shows the data of the imaginary parts, the horizontal axis the real parts.
The locus ( ) of the PT 2 element runs from point K on the positive real axis, depending on the damping d, through the fourth and third quadrants for from the direction of the negative real axis to point 0.


Locus of a PT
2 link (K = 2, T = 1, D = 0.2; 1; 5)
See also
Web links
Individual evidence
-
^ H. Lutz, W. Wendt: Pocket book of control engineering with MATLAB and Simulink . 11th, supplemented edition. Verlag Europa-Lehrmittel, 2019, ISBN 978-3-8085-5869-0 .
-
↑ Author: Jan Lunze / Control Engineering 1; Springer Vieweg, Berlin, 8th edition 2014, ISBN 978-3-642-53943-5 ; Main chapter: Transfer function, sub-chapter: Poles and zeros.
-
↑ Gerd Schulz: Control engineering 1. 2007, chapter "Oscillating routes".
-
↑ Identification of a damped PT2 system | Hackaday.io. Retrieved July 27, 2018 .
-
↑ Lutz / Wendt: Pocket book of control engineering with MATLAB and Simulink, chapter: PT2 element, proportional element with second order delay.


.png)


