White light interferometry

|

|

|

|
The white-light interferometry (WLI) is a contactless optical measuring method, which the interference broadband light ( white-light exploiting) and so 3D profile measurements of structures having dimensions of between a few centimeters and a few micrometers allowed.
Signal generation
If one varies the path length difference Δz between the two arms of the interferometer, a signal results in the interferometer output as shown in the figure on the right as curve (3). The intensity of the signal decreases significantly when the amount of Δz is significantly greater than the coherence length . The exact form of the signal depends on the mean wavelength and the spectrum as well as the coherence length of the light source used.
construction
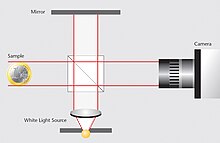
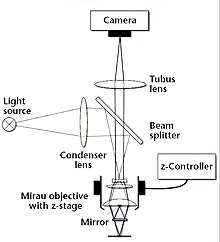
The measurement object is placed in one arm of the white light interferometer. The light from the source is collected by a condenser lens , coupled into the beam path and divided into reference and measuring beams by a beam splitter . One beam is reflected by the reference mirror, while the other beam is reflected or scattered by the surface of the measurement object. The returning beams are forwarded by the beam splitter to the CCD sensor and, depending on the position of the measurement object, form an interference signal for each individual pixel . As explained below, the correlogram width corresponds to the coherence length of the light and therefore depends on the spectral width of the light source .
functionality
A rough object surface results in a speckle pattern that interferes with the light from the reference plane in the detector plane. Every single speckle has a random phase . The phase remains almost constant within a speckle. Therefore, interference appears on the camera pixel when the optical path lengths of the two arms differ by less than half the coherence length of the light source. Each pixel of the camera sensor scans a typical white light correlogram (interference signal) when the length of the reference arm or the measuring arm is changed with a positioning unit. The interference signal of a pixel has a maximum modulation when the optical path length of the light that strikes the pixel is exactly the same for the reference and measuring beam. Therefore, the z-value of the point on the surface which is mapped onto this pixel corresponds to the z-value of the positioning unit when the modulation of the correlogram is maximum. A matrix with the height values of the object surface can be derived by determining the z-values of the positioning unit for each individual camera pixel at which the modulation is maximum. The height uncertainty depends mainly on the roughness of the measured surface. With smooth surfaces, the measuring accuracy is limited by the accuracy of the positioning unit. The lateral positions of the height values depend on the corresponding object point that is mapped onto the matrix of the camera pixels. The x-coordinates together with the corresponding y-coordinates describe the geometric shape of the measured object.
Areas of application
The fact that interference only occurs when the object and reference arm are aligned can be used to measure distances with appropriate devices (white light interferometer). Examples are topographic coherence radar and volumetric optical coherence tomography . The synchronicity of the individual wavelengths or frequency components is distorted or disturbed by dispersion - the optical path length is frequency-dependent. Since the white light interferometer reacts sensitively to this, the WLI can also be used for dispersion measurement. Since the spectrum is linked to its autocorrelation via the Fourier series , spectroscopic measurements can also be carried out with an interferogram, which is recorded over the entire coherence length . A method that goes beyond white light interferometry is non-linear autocorrelation, in which the signal curves of optical pulses are measured.
White light interferometers in microscopes
To make microscopic structures visible, the interferometer must be combined with the optical structure of a microscope . The structure is similar to a standard optical microscope. The only differences are an interferometric objective lens and an accurate positioning unit (a piezo-electric actuator) to move the interference objective vertically. If the microscope objective images the measuring object at infinity, the optical magnification of the image on the CCD chip does not depend on the distance between the tube lens and the objective lens. The interference lens is the most important part of an interferometer microscope. There are different types of lenses. With a Mirau objective, the reference beam is reflected back towards the objective front lens by a beam splitter. On the objective front lens there is a tiny mirror the same size as the illuminated surface on the measurement object. At high magnifications, the mirror is so small that its shadowing can be neglected. By moving the interference lens, the length of the measuring arm is changed. The interference signal of a pixel has a maximum modulation when the optical path length of the light that strikes the pixel is exactly the same for the reference and measuring beam. Therefore, the z-value of the point on the surface which is mapped onto this pixel corresponds to the z-value of the positioning unit when the modulation of the correlogram is maximum.
Relationship between spectral width and coherence length
As described above, the z-value of the positioning unit at which the modulation of the interference signal is maximum for a specific pixel defines the height value for this pixel. Therefore, the quality and shape of the correlogram have a major impact on the resolution and accuracy of the system. The most important parameters of the light source are its wavelength and its coherence length. The coherence length defines the correlogram width. The coherence length in turn relates to the spectral width of the light source. Therefore, the correlogram width depends on the spectral width of the light source. The figure shows the spectral density function for a Gaussian spectrum , which is a good approximation for an LED , for example . It can be seen that the corresponding intensity modulation is only important in the area around the position z 0 , where the reference and measurement beams have the same length and coherently overlap. The z-range of the positioning unit, in which the envelope curve of the intensity modulation is more than 1 / e of the maximum value, determines the correlogram width. The correlogram width corresponds to the coherence length, since the difference in the optical path length is twice the length difference between the reference arm and the measuring arm of the interferometer. The ratio between correlogram width, coherence length and spectral width is calculated below for the example of a Gaussian spectrum.
Coherence length and spectral width of a Gaussian spectrum
The normalized spectral density function is given by equation 1:
where is the effective 1 / e bandwidth and the mean frequency. According to the general Wiener-Khintchine theorem , the auto-correlation function of the light field is given by the Fourier transformation of the spectral density, see equation 2:
- ,
which is measured by interference of the light fields of the reference and measuring beam. Taking into account that the intensities are the same in both interferometer arms, the result for the intensity that can be observed on the screen is given by Equation 3:
- ,
specified context. Here is with and as respective intensities on the object sensor and on the reference arm. The mean frequency can be formulated using the central wavelength and the effective bandwidth using the coherence length . From equations 2 and 3 it follows for the intensity on the screen that in equation 4:
depicted context. It must be taken into account that , where is the speed of light . Hence, equation 4 describes the correlogram as shown in the picture. It can be seen that the intensity distribution is formed by a Gaussian envelope and a periodic modulation with the period . For each pixel the correlogram is scanned with a specific step size of the z-shift. In addition, phase shifts on the reflecting surface of the measuring object, inaccuracies in the positioning unit, distribution differences between the arms of a real interferometer, reflections from surfaces other than the object surface and noise in the camera sensor lead to a deformed correlogram. A real correlogram can therefore differ from the result from equation 4, but the result illustrates the strong dependency of the correlogram on the two parameters wavelength and coherence length of the light source.
The calculation of the envelope maximum
The envelope is described by the exponential term in equation 4, see equation 5:
- .
The software calculates the envelope curve from the correlogram data. The principle of the envelope calculation is to remove the cosine term from equation 4. The cosine term is converted into a sine term using a Hilbert transformation. The envelope curve is obtained by adding up the powers of the cosine and sine modulated correlograms, see equation 6:
- .
Two slightly different algorithms are used to calculate the envelope maximum . The first algorithm evaluates the envelope of the correlogram. The z-value is derived from the maximum of the envelope curve. The second algorithm also evaluates the phase. With the help of automation interfaces (e.g. macros ), either of the two algorithms can be used. The uncertainty of the calculation of the envelope curve maximum depends on: the coherence length, the scanning step size of the correlogram, deviations from the z-values compared to specified values (e.g. due to vibrations), the contrast and the roughness of the surface. The best results are achieved with a short coherence length, a small scanning step size, good vibration isolation, high contrast and a smooth surface.
Web links
- White Light Interferometer in the Encyclopedia of Laser Physics and Technology (Engl.)
- Basics of white light interferometry (637 kB)
- Functional principle of white light interferometry (video; WMV ; 5.8 MB)


![S (\ nu) = \ frac {1} {\ sqrt {\ pi} \ Delta \ nu} \ exp \ left [- \ left (\ frac {\ left (\ nu- \ nu_0 \ right)} {\ Delta \ nu} \ right) ^ 2 \ right]](https://wikimedia.org/api/rest_v1/media/math/render/svg/875f1108e8a070306383d142ec214e6109976e89)


![{\ displaystyle I (z) = I_ {0} \ left (1+ \ exp \ left [-4 \ left ({\ frac {\ left (z-z_ {0} \ right)} {l _ {\ mathrm { c}}}} \ right) ^ {2} \ right] \ cos \ left (4 \ pi {\ frac {z-z_ {0}} {\ lambda _ {0}}} - \ varphi _ {0} \ right) \ right)}](https://wikimedia.org/api/rest_v1/media/math/render/svg/d7e95747a5717edcb410abfd318fd54f86b2f0a1)


![{\ displaystyle E (z) = \ exp \ left [-4 \ left ({\ frac {\ left (z-z_ {0} \ right)} {l _ {\ mathrm {c}}}} \ right) ^ {2} \ right]}](https://wikimedia.org/api/rest_v1/media/math/render/svg/0fa3a3e73efb9aca965adc7588c246252e1f547d)
![{\ displaystyle E (z) = {\ sqrt {\ left (\ exp \ left [-4 \ left ({\ frac {\ left (z-z_ {0} \ right)} {l _ {\ mathrm {c} }}} \ right) ^ {2} \ right] \ cos \ left (4 \ pi {\ frac {z-z_ {0}} {\ lambda _ {0}}} \ right) \ right) ^ {2 } + \ left (\ exp \ left [-4 \ left ({\ frac {\ left (z-z_ {0} \ right)} {l _ {\ mathrm {c}}}} \ right) ^ {2} \ right] \ sin \ left (4 \ pi {\ frac {z-z_ {0}} {\ lambda _ {0}}} \ right) \ right) ^ {2}}}}](https://wikimedia.org/api/rest_v1/media/math/render/svg/e90e4db1f9df94a61fe10b866231cd8d19f07a0c)