
Demographics of South Korea
.png)
With a population of around 51.7 million, South Korea was the 27th most populous country in the world and at the same time is one of the most densely populated in the world. During the 20th century , the country's population experienced a dramatic expansion and extensive urbanization and industrialization . This made one of the fastest demographic transitions of all time in the country . South Korea has struggled with a very low birth rate since the 1990s, leading some researchers to believe that the country's population will shrink to around 38 million by the end of the 21st century if current developments continue. In 2018, fertility in South Korea again became a topic of international debate, as only an estimated 325,000 babies were born that year and the fertility rate dropped below one child per woman. This means that the country has the lowest fertility rate in the world.
National demographics

Population 1955

Population 1960
Population 1965

Population 1970

Population 1975
Population 1980

Population 1985

Population 1990
Population 1995

Population 2000

Population 2005
Population 2010

Population 2015


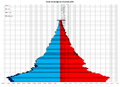
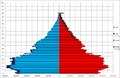
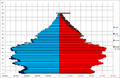
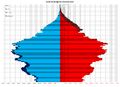
The population of South Korea has experienced robust growth since the republic was founded in 1948, which has slowed sharply due to the effects of economic growth . In the first official census of 1949, the total population of South Korea was 20,188,641 people. The 1985 census showed the population doubled to 40,466,577. The population growth was in the period from 1949 to 1955, when the population was 21.5 million, averaging about 1.1% per year. Growth accelerated to 29.2 million between 1955 and 1966, or an annual average of 2.8%, but fell significantly in the period from 1966 to 1985 to an annual average of 1.7%. Thereafter, the average annual growth rate fell below 1%, similar to the low growth rates of most industrialized countries and the target set by the Ministry of Health and Social Affairs for the 1990s. As of January 1, 1989, the population of South Korea was estimated to be approximately 42.2 million people. The proportion of the population under fifteen has increased and then decreased with the rate of growth. In 1955, approximately 41.2% of the population was under fifteen years old, a percentage that rose to 43.5% in 1966 before rising to 38.3% in 1975, 34.2% in 1980 and 29.9% in 1985 decreased. In the past, the proportion of children in relation to the total population was large and weighed heavily on the country's economy, mainly because of the considerable investment in educational institutions. With the slowdown in the rate of population growth and an increase in the average age (from 18.7 years to 21.8 years between 1960 and 1980), the age structure of the population was already more like the columnar pattern of the developed countries than the pyramid pattern in most parts of the Third World . The decline in the rate of population growth and the proportion of people under the age of fifteen after 1966 reflected the success of official and unofficial prevention programs. The government of President Rhee Syng-man (1948–1960) was conservative on such matters. Although the Christian churches launched a campaign against family planning in 1957, the Park Chung Hee government , concerned about how rapidly growing populations were undermining economic growth, began a nationwide family planning program. Other factors that have contributed to slowing population growth have been urbanization, the later age of marriage for men and women, higher levels of education , greater numbers of women in employment and better health standards .
Public and private institutions involved in family planning included the Ministry of Health and Welfare, the Ministry of Interior, the Proposed Parents Association of Korea, and the Korean Institute for Family Planning. In the late 1980s, their activities included selling free birth control devices and information, training women on family planning methods , and granting special grants and privileges (such as low-interest loans) to parents wishing to undergo sterilization . In 1984, 502,000 South Koreans were sterilized, compared to 426,000 the previous year.
The Maternal and Child Health Act of 1973 legalized abortion . In 1983, the government began to suspend health insurance benefits for maternal care for pregnant women with three or more children. She also refused to allow parents with two or more children to deduct tax on education expenses.
As in China, cultural attitudes caused problems in family planning programs. A strong preference for sons - who are expected to care for their parents in old age under the traditional Confucian value system of Korea and to continue the family name - means that parents with only daughters usually have children until a son is born. The government encouraged married couples to have only one child at the same time. To date, significantly more boys than girls are born in South Korea, which points to cases of gender-selective abortion .
The overall fertility rate (the average number of children a woman will have during her lifetime) decreased from 6.1 births per woman in 1960 to 4.2 in 1970, 2.8 in 1980 and 2.4 in Year 1984. The number of live births, which was registered in 1978 at 711,810, grew in 1982 to a high of 917,860. This development sparked fears among family planning experts about a new "baby boom". By 1986, however, the number of live births had dropped to 806,041.
Population growth continued to decline, and between 2005 and 2010 the fertility rate for South Korean women was 1.21 and was one of the lowest in the world, according to the United Nations . The fertility rate, well below the substitute value of 2.1 births per woman, has caused a national alarm with dire predictions of an aging society unable to care for or support the elderly. The recent Korean governments have prioritized the issue on their agenda, promising to implement social reforms that encourage women to have children.
However, the measures introduced so far have not been able to turn things around. In fact, the rate of aging in Korea is unprecedented in human history and even surpasses that of Japan . The reasons for the extremely low birth rate are high real estate prices in cities, long working hours, economic pressure and discrimination against mothers in the labor market. This is why women do not have their first child until the age of 31, which is one of the latest times in the world. If current trends are not reversed, there is a risk of the median age increasing to around 54 years by 2050 and an annual population loss from the 2020s. South Korea would thus be the oldest society in the world, which would put a heavy strain on the economic sustainability of the social security systems and would likely severely restrict economic growth.
Ethnic groups
Koreans are one of the most homogeneous and endogamous peoples of mankind. They are genetically related to Northeast Asians and show a close relationship with the Japanese , the Manchu , the North Chinese , the Ultschen , the Niwchen and some other Siberian peoples, as well as the native Americans . The South Koreans regard the common language and, above all, ethnicity as an important part of their identity . Korean society is still relatively homogeneous and 96% of the population are Koreans. However, due to increasing labor shortages and the rapid aging of society, the country is increasingly opening up to immigration . From 2004 to 2014, the number of registered foreigners in South Korea rose from around 469,000 to 1.1 million. South Korea's immigration regulations remain strict, especially for non-Asians. By far the largest group of foreigners is currently from the People's Republic of China .
Before its economic development, South Korea was primarily a country of emigration. There is a large diaspora of Korean descent living abroad, predominantly in the United States .
| rank | Country of origin | number |
|---|---|---|
| 1 |
|
1,016,607 |
| 2 |
|
149.384 |
| 3 |
|
140.222 |
| 4th |
|
100,860 |
| 5 |
|
56,980 |
| 6th |
|
54,490 |
| 7th |
|
51,297 |
| 8th |
|
47,606 |
| 9 |
|
45,832 |
| 10 |
|
35.206 |
Demographic statistics since 1925
Registered births and deaths
Source:
| year | population | Births | Deaths | change |
Birth rate (per 1,000 inhabitants) |
Death rate (per 1,000 inh.) |
Change (per 1,000 inhabitants) |
Fertility per woman |
|---|---|---|---|---|---|---|---|---|
| 1925 | 12,997,611 | 558.897 | 359.042 | 199,855 | 43.0 | 27.6 | 15.4 | 5.95 |
| 1926 | 13,052,741 | 511,667 | 337.948 | 173.719 | 39.2 | 25.9 | 13.3 | 5.91 |
| 1927 | 13,037,169 | 534.524 | 353.818 | 180,706 | 41.0 | 27.1 | 13.9 | 5.89 |
| 1928 | 13.105.131 | 566.142 | 357.701 | 208,441 | 43.2 | 27.3 | 15.9 | 5.87 |
| 1929 | 13.124.279 | 566,969 | 414.366 | 152.603 | 43.2 | 31.6 | 11.6 | 5.9 |
| 1930 | 13,880,469 | 587.144 | 322,611 | 264,533 | 42.3 | 23.2 | 19.1 | 5.93 |
| 1931 | 13,895,052 | 589,428 | 346,800 | 242,628 | 42.4 | 25.0 | 17.4 | 5.96 |
| 1932 | 14,117,191 | 600,545 | 384.287 | 216.258 | 42.5 | 27.2 | 15.3 | 5.99 |
| 1933 | 14.229.277 | 607.021 | 336.232 | 270,789 | 42.7 | 23.6 | 19.1 | 6.02 |
| 1934 | 14,449,155 | 618.135 | 356,515 | 261,620 | 42.8 | 24.7 | 18.1 | 6.05 |
| 1935 | 15,061,960 | 646.158 | 377.454 | 268,704 | 42.9 | 25.1 | 17.8 | 6.08 |
| 1936 | 15.114.775 | 639.355 | 381,806 | 257,549 | 42.3 | 25.3 | 17.0 | 6.12 |
| 1937 | 15.235.383 | 636.839 | 342,575 | 294.264 | 41.8 | 22.5 | 19.3 | 6.15 |
| 1938 | 15,358,193 | 569.299 | 347.025 | 222.274 | 37.1 | 22.6 | 14.5 | 6.18 |
| 1939 | 15,486,028 | 585,482 | 353.391 | 232.091 | 37.8 | 22.8 | 15.0 | 6.16 |
| 1940 | 15,559,741 | 527.964 | 358.496 | 169,468 | 33.9 | 23.0 | 10.9 | 6.14 |
| 1941 | 15,745,478 | 553,690 | 366.239 | 187.451 | 35.2 | 23.3 | 11.9 | 6.12 |
| 1942 | 16,013,742 | 533,768 | 376.003 | 157.765 | 33.3 | 23.5 | 9.8 | 6.1 |
| 1943 | 16,239,721 | 513.846 | 384,881 | 128,965 | 31.6 | 23.7 | 7.9 | 6.08 |
| 1944 | 16,599,172 | 533.215 | 380.121 | 153.094 | 32.1 | 22.9 | 9.2 | 5.98 |
| 1945 | 16,695,819 | 544.786 | 367,308 | 177.478 | 32.6 | 22.0 | 10.6 | 5.88 |
| 1946 | 19,369,270 | 590.763 | 410,629 | 180.134 | 30.5 | 21.2 | 9.3 | 5.79 |
| 1947 | 19,836,234 | 686.334 | 361.019 | 325.315 | 35.0 | 18.2 | 16.8 | 5.69 |
| 1948 | 20,027,393 | 692.948 | 374,512 | 318,436 | 34.6 | 18.7 | 15.9 | 5.59 |
| 1949 | 20.188.641 | 696.508 | 341.188 | 355,320 | 34.5 | 16.9 | 17.6 | 4.81 |
| 1950 | 19,211,386 | 633.976 | 597.474 | 36.502 | 33.0 | 31.1 | 1.9 | 5.05 |
| 1951 | 19,304,737 | 675,666 | 579.142 | 96,524 | 35.0 | 30.0 | 5.0 | |
| 1952 | 19,566,860 | 722.018 | 457.865 | 264.153 | 36.9 | 23.4 | 13.5 | |
| 1953 | 19,979,069 | 777.186 | 363,619 | 413,567 | 38.9 | 18.2 | 20.7 | |
| 1954 | 20.520.601 | 839.293 | 364,850 | 490.433 | 40.9 | 17.0 | 23.9 | |
| 1955 | 21,168,611 | 908.134 | 295,302 | 612.832 | 42.9 | 14.0 | 28.9 | 6.33 |
| 1956 | 21,897,911 | 945.990 | 294,344 | 651,646 | 43.2 | 13.4 | 29.8 | |
| 1957 | 22,681,233 | 963,952 | 293,344 | 670.608 | 42.5 | 12.9 | 29.6 | |
| 1958 | 23,490,027 | 993.628 | 291,864 | 701.764 | 42.3 | 12.4 | 29.9 | |
| 1959 | 24,295,786 | 1,016,173 | 289,525 | 726.648 | 41.8 | 11.9 | 29.9 | |
| 1960 | 25,012,374 | 1,080,535 | 285,350 | 795.185 | 43.2 | 11.4 | 31.8 | 6.16 |
| 1961 | 25,765,673 | 1,046,086 | 280,846 | 765.240 | 40.6 | 10.9 | 29.7 | 5.99 |
| 1962 | 26,513,030 | 1,036,659 | 270,433 | 760.266 | 39.1 | 10.2 | 28.9 | 5.79 |
| 1963 | 27,261,747 | 1,033,220 | 278.070 | 755.150 | 37.9 | 10.2 | 27.7 | 5.57 |
| 1964 | 27.984.155 | 1,001,833 | 279,842 | 721.991 | 35.8 | 10.0 | 25.8 | 5.36 |
| 1965 | 28,704,674 | 996.052 | 272,694 | 723.358 | 34.7 | 9.5 | 25.2 | 5.16 |
| 1966 | 29,435,571 | 1,030,245 | 294,356 | 735.889 | 35.0 | 10.0 | 25.0 | 4.99 |
| 1967 | 30.130.983 | 1.005.293 | 242.280 | 763.013 | 33.4 | 8.0 | 25.4 | 4.84 |
| 1968 | 30.838.302 | 1,043,321 | 280.308 | 763.013 | 33.8 | 9.1 | 24.7 | 4.72 |
| 1969 | 31,544,266 | 1,044,943 | 270.023 | 774.920 | 33.1 | 8.6 | 24.5 | 4.62 |
| 1970 | 32,240,827 | 1,006,645 | 258,589 | 748.056 | 31.2 | 8.0 | 23.2 | 4.53 |
| 1971 | 32,882,704 | 1,024,773 | 237,528 | 787.245 | 31.2 | 7.2 | 23.9 | 4.54 |
| 1972 | 33.505.406 | 952.780 | 210.071 | 742.709 | 28.4 | 6.3 | 22.2 | 4.12 |
| 1973 | 34.103.149 | 965,521 | 267,460 | 698.061 | 28.3 | 7.8 | 20.5 | 4.07 |
| 1974 | 34,692,266 | 922,823 | 248,807 | 674.016 | 26.6 | 7.2 | 19.4 | 3.77 |
| 1975 | 35.280.725 | 874.030 | 270,657 | 603.373 | 24.8 | 7.7 | 17.1 | 3.43 |
| 1976 | 35,848,523 | 796.331 | 266,857 | 529.474 | 22.2 | 7.4 | 14.8 | 3.00 |
| 1977 | 36,411,795 | 825.339 | 249.254 | 576.085 | 22.7 | 6.8 | 15.8 | 2.99 |
| 1978 | 36,969,185 | 750.728 | 252,298 | 498.430 | 20.3 | 6.8 | 13.5 | 2.64 |
| 1979 | 37,534,236 | 862,669 | 239.986 | 622,683 | 23.0 | 6.4 | 16.6 | 2.90 |
| 1980 | 38.123.775 | 862.835 | 277.284 | 585,551 | 22.6 | 7.3 | 15.4 | 2.82 |
| 1981 | 38.723.248 | 867,409 | 237,481 | 629.928 | 22.4 | 6.1 | 16.3 | 2.57 |
| 1982 | 39,326,352 | 848.312 | 245,767 | 602,545 | 21.6 | 6.2 | 15.3 | 2.39 |
| 1983 | 39.910.403 | 769.155 | 254,563 | 514,592 | 19.3 | 6.4 | 12.9 | 2.06 |
| 1984 | 40,405,956 | 674.793 | 236,445 | 438,348 | 16.7 | 5.9 | 10.8 | 1.74 |
| 1985 | 40,805,744 | 655.489 | 240.418 | 415.071 | 16.1 | 5.9 | 10.2 | 1.66 |
| 1986 | 41,213,674 | 636.019 | 239.256 | 396.763 | 15.4 | 5.8 | 9.6 | 1.58 |
| 1987 | 41,621,690 | 623.831 | 243.504 | 380,327 | 15.0 | 5.9 | 9.1 | 1.53 |
| 1988 | 42,031,247 | 633.092 | 235.779 | 397.313 | 15.1 | 5.6 | 9.5 | 1.55 |
| 1989 | 42,449,038 | 639.431 | 236.818 | 402.613 | 15.1 | 5.6 | 9.5 | 1.56 |
| 1990 | 42,869,283 | 649.738 | 241,616 | 408.122 | 15.2 | 5.6 | 9.5 | 1.57 |
| 1991 | 43.295.704 | 709.275 | 242,270 | 467.005 | 16.4 | 5.6 | 10.8 | 1.71 |
| 1992 | 43,747,962 | 730.678 | 236.162 | 494,516 | 16.7 | 5.4 | 11.3 | 1.76 |
| 1993 | 44.194.628 | 715.826 | 234.257 | 481,569 | 16.0 | 5.2 | 10.8 | 1.65 |
| 1994 | 44,641,540 | 721.185 | 242,439 | 478,746 | 16.0 | 5.4 | 10.6 | 1.66 |
| 1995 | 45.092.991 | 715.020 | 242,838 | 472.182 | 15.7 | 5.3 | 10.3 | 1.63 |
| 1996 | 45,524,681 | 691.226 | 241.149 | 450,077 | 15.0 | 5.2 | 9.8 | 1.57 |
| 1997 | 45,953,580 | 668.344 | 241.943 | 426,401 | 14.4 | 5.2 | 9.2 | 1.52 |
| 1998 | 46.286.503 | 634.790 | 243.193 | 391,597 | 13.6 | 5.2 | 8.4 | 1.45 |
| 1999 | 46,616,677 | 614.233 | 245.364 | 368,869 | 13.0 | 5.2 | 7.8 | 1.41 |
| 2000 | 47.008.111 | 634.501 | 246.163 | 388,838 | 13.3 | 5.2 | 8.2 | 1.47 |
| 2001 | 47.370.164 | 554,895 | 241,521 | 313,374 | 11.6 | 5.0 | 6.5 | 1.30 |
| 2002 | 47,644,736 | 492.111 | 245.317 | 246,794 | 10.2 | 5.1 | 5.1 | 1.17 |
| 2003 | 47,892,330 | 490.543 | 244.506 | 246.037 | 10.2 | 5.1 | 5.1 | 1.18 |
| 2004 | 48,082,519 | 472.761 | 244.217 | 228,544 | 9.8 | 5.0 | 4.7 | 1.15 |
| 2005 | 48.184.561 | 435.031 | 243,883 | 191.148 | 8.9 | 5.0 | 3.9 | 1.08 |
| 2006 | 48,438,292 | 448.153 | 242.266 | 205,887 | 9.2 | 5.0 | 4.2 | 1.12 |
| 2007 | 48,683,638 | 493.189 | 244,874 | 248,315 | 10.0 | 5.0 | 5.1 | 1.25 |
| 2008 | 49.054.708 | 465.892 | 246.113 | 219.779 | 9.4 | 5.0 | 4.4 | 1.19 |
| 2009 | 49,307,835 | 444,849 | 246,942 | 197.907 | 9.0 | 5.0 | 4.0 | 1.15 |
| 2010 | 49,554,112 | 470.171 | 255.405 | 214,766 | 9.4 | 5.1 | 4.3 | 1.23 |
| 2011 | 49,936,638 | 471.265 | 257.396 | 213,869 | 9.4 | 5.1 | 4.3 | 1.24 |
| 2012 | 50.199.853 | 484,550 | 267.221 | 217,329 | 9.6 | 5.3 | 4.3 | 1.30 |
| 2013 | 50,428,893 | 436.455 | 266.257 | 170.198 | 8.6 | 5.3 | 3.4 | 1.19 |
| 2014 | 50,746,659 | 435,435 | 267,692 | 167,743 | 8.6 | 5.3 | 3.3 | 1.21 |
| 2015 | 51,014,947 | 438.420 | 275,895 | 162,525 | 8.6 | 5.4 | 3.2 | 1.24 |
| 2016 | 51.245.707 | 406.243 | 280,827 | 125,416 | 7.9 | 5.5 | 2.4 | 1.17 |
| 2017 | 51.446.201 | 357.771 | 285,534 | 72,237 | 7.0 | 5.6 | 1.4 | 1.05 |
| 2018 | 51.635.256 | 326.822 | 298.936 | 27,886 | 6.4 | 5.8 | 0.6 | 0.98 |
urbanization
Like other emerging economies , South Korea has seen rapid urban growth caused by large numbers of people leaving the countryside. Until the 1970s, South Korea was primarily an agricultural society, and it is now one of the most urbanized countries in the world. In 2017, 81.5% of the population lived in cities (in 1960 it was 27.7% of the population) Almost half of the population lives in the catchment area of the capital Seoul . Due to the lack of space, a large part of the population lives in apartment blocks in suburbs .
| year | Urbanization rate in% |
|---|---|
| 1960 | 27.71% |
| 1970 | 40.70% |
| 1980 | 56.72% |
| 1990 | 73.84% |
| 2000 | 79.62% |
| 2010 | 81.94% |
| 2017 | 81.50% |
health
The life expectancy has been increasing rapidly and South Korea was in 2016 the world's number 11 in life expectancy. South Korea has one of the lowest HIV / AIDS prevalence rates in the world, with only 0.1% of the population infected. South Korea also has one of the lowest child mortality rates . South Korea also has a very low rate of severely obese people at 4.7% compared to other developed countries. However, the percentage of smokers and alcohol consumption per capita is among the highest in the world. Suicide is a serious and widespread problem in South Korea, especially among young people. The suicide rate was the second highest in the OECD in 2015 (25.8 deaths per 100,000 people).
Development of life expectancy from 1908 to 2015
Source: Our World In Data and the UN .
1865-1949
| Years | 1908 | 1913 | 1918 | 1923 | 1928 | 1933 | 1938 | 1942 | 1950 |
|---|---|---|---|---|---|---|---|---|---|
| Life expectancy in years | 23.5 | 25.0 | 27.0 | 29.5 | 33.6 | 37.4 | 42.6 | 44.9 | 46.7 |
1950-2015
| period | Life expectancy in years |
period | Life expectancy in years |
|---|---|---|---|
| 1950-1955 | 47.9 | 1985-1990 | 70.3 |
| 1955-1960 | 51.2 | 1990-1995 | 72.9 |
| 1960-1965 | 54.8 | 1995-2000 | 75.0 |
| 1965-1970 | 58.8 | 2000-2005 | 77.2 |
| 1970-1975 | 63.1 | 2005-2010 | 79.4 |
| 1975-1980 | 65.0 | 2010-2015 | 81.3 |
| 1980-1985 | 67.4 |
Source: UN World Population Prospects
languages
The Korean language is the mother tongue spoken by the vast majority of the population. English is generally taught as a foreign language in both public and private schools. However, compared to other industrialized countries, general English language skills in the country are relatively low. There is a Chinese minority who speak Mandarin and Cantonese . Some elderly people may still speak Japanese , which was official during the Japanese rule in Korea (1905–1945).
religion
Koreans have historically lived under the religious influences of shamanism , Buddhism , Daoism, or Confucianism . Christianity gained influence through Western missionaries . In 2015, 27.6% of the population were Christians ( Protestants : 19.7%, Catholics : 7.9%), 15.5% were Buddhists and 56.9% had no religion or practiced Confucianism or Daoism. South Korea is one of the most secularized countries in the world.
Individual evidence
- ↑ population, total | Data. Retrieved February 15, 2019 .
- ↑ a b c World Population Prospects - Population Division - United Nations . Retrieved July 15, 2017.
- ^ South Korea's fertility rate is the lowest in the world . In: The Economist , June 30, 2018. Retrieved January 23, 2019.
- ↑ Fertility rate dips below 1 in 2018: official . January 30, 2019. Archived from the original on February 3, 2019. Retrieved January 30, 2019.
- ↑ Thomas Klassen "South Korean: Aging Tiger" , Global letter 12 January, 2010.
- ^ Benjamin Haas: South Korea's fertility rate set to hit record low of 0.96 . In: The Guardian . September 3, 2018, ISSN 0261-3077 ( theguardian.com [accessed February 16, 2019]).
- ↑ Reference Populations - Geno 2.0 Next Generation. (2017). The Genographic Project. 15th May 2017
- ↑ Korean Culture and Information Service (KOCIS): Researchers discover Korean genetic roots in 7,700-year-old skull: Korea.net: The official website of the Republic of Korea. Accessed August 29, 2018 .
- ^ Population of registered foreigners. In: Korean Statistical Information Service. Ministry of Justice of Korea, accessed February 23, 2016 .
- ↑ a b Statistics Korea. Retrieved February 15, 2019 .
- ↑ https://regnum.ru/news/2554761.html
- ↑ a b Urban population (% of total) | Data. Retrieved February 15, 2019 .
- ↑ World Health Statistics 2016: Monitoring health for the SDGs . In: WHO .
- ↑ Databook 2017. (PDF) In: UNAids. Retrieved July 4, 2018 .
- ↑ Global Obesity Levels - Obesity - ProCon.org. Retrieved February 16, 2019 .
- ↑ WHO | World Health Organization ( en )
- ^ Suicide rates . In: OECD . 2015. Accessed February 16, 2019.
- ^ Life expectancy . Retrieved August 28, 2018.
- ↑ Languages in South Korea (en-US) . In: Gap Year , April 8, 2015. Retrieved April 12, 2018.
- ^ East Asia / Southeast Asia :: Korea, South - The World Factbook - Central Intelligence Agency. Retrieved February 15, 2019 .