Dielectric Spectroscopy
The dielectric spectroscopy is a method of impedance spectroscopy , the dielectric properties of a recorded medium. As with all impedance spectroscopic methods, the impedance , i.e. H. the alternating current resistance, determined as a function of frequency . Dielectric spectroscopy is based on the interaction of an external electric field with the dipole moment of the examined medium, which is given by the dielectric constant of the medium.
Dielectric Mechanisms
There are various dielectric mechanisms, which are distinguished according to the way in which the examined medium reacts to the applied field. Each of these mechanisms is associated with a characteristic frequency which is the reciprocal of the characteristic time of the process. Starting at high frequencies, the main mechanisms are as follows:
Electronic polarization
→ Main article: Displacement polarization
Also known as electronic displacement polarization. This reaction takes place in neutral atoms when the applied electric field changes the electron density around the atomic nucleus. Figure 2 shows schematically an atomic nucleus including an electron shell in the absence of a field. Figure 3 shows the state in which there is an equilibrium between the nuclear binding forces and those of the electric field.
Atomic polarization
Atomic polarization takes place when the electron clouds are deformed under the action of the forces of the applied electric field, so that positive and negative charge zones are created. This is a process of resonance.
Orientation polarization
→ Main article: Orientation polarization
This effect has its origin in permanent and induced dipoles , which are aligned in the electric field. Their orientation polarization is disturbed by thermal noise that is not aligned with the electric field. The time that the dipoles need to relax is determined by the local viscosity of the medium. These two properties make the dipole relaxation highly dependent on the temperature and the chemical properties of the medium. Figure 4 shows dipoles in the absence of an electric field. In Figure 5, aligned dipoles in the presence of an electric field are shown.
Ionic shift polarization
The ionic shift polarization includes ionic conductivity and interface and space charge polarization. The ion conductivity dominates at low frequencies and is due to system losses. Interface polarization occurs when charge carriers meet interfaces in heterogeneous systems. Figure 6 shows an ion lattice in the absence of an electric field. Figure 7 shows the ionic displacement polarization in the presence of an electric field.
Dielectric relaxation
The dielectric relaxation as a whole is the result of the movement of the dipoles (dipole relaxation) and the charge carriers (ionic relaxation) caused by an applied alternating field. It is usually observed in frequency ranges from 100 Hz to 10 GHz. Relaxation mechanisms are relatively slow compared to resonance electronic transitions or molecular movements , which usually occur in frequencies above 1 THz.
application areas
In many areas in which the investigation and assessment of material or system properties play a role, dielectric spectroscopy is also important. In addition to electrical engineering and material physics, areas of application can be e.g. B. biological and biomedical systems or geophysics ( Spectral Induced Polarization , SIP).
Electrical engineering
Dielectric spectroscopy is of technical relevance, especially when assessing insulation materials . This can be, for example, cable insulation in high-frequency or high-voltage technology, or oil-paper insulation in transformers or other high-voltage equipment.
Measurement of the dielectric response
In dielectric spectroscopy, the dielectric response of a system in the frequency domain can be determined using two different methods. A combination of these methods described below is possible. This can be useful to outweigh the advantages and disadvantages of the respective methods.
Frequency domain spectroscopy (FDS)
In frequency domain spectroscopy (FDS), the system to be examined is exposed to an alternating field. The system response is recorded directly in the frequency domain. This method is particularly suitable for high frequencies.
Polarization and depolarization current measurement (PDC)
With polarization and depolarization current measurement ( Polarization Depolarization Current , PDC), the system to be examined is exposed to a constant field. The system response is determined from the measured polarization currents. For this purpose, these are transformed into the frequency range. This method is particularly advantageous at low frequencies.
Basic measurement setup
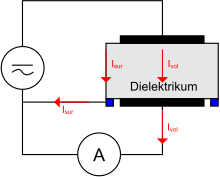
The same basic measurement setup is used for both methods. A voltage source generates a field in a dielectric. The current flowing through this medium is measured with an ammeter . A guard electrode is used to guide surface currents past the measurement so that only the volume flow is measured. This arrangement is shown in Figure 8. The examination object (dielectric) depends on the application.
Presentation, evaluation and interpretation of the measurement results
The basics of the presentation (using the Cole-Cole diagram , Nyquist diagram or Bode diagram ), evaluation and interpretation of the measurement results are the same as for other impedance spectroscopic methods and are described here .
literature
- Siegmund Brandt , Hans D. Dahmen: Electrodynamics: An Introduction to Experiment and Theory . 3. Edition. Springer, 1997, ISBN 3-540-61911-9 .
- Dietmar Ende, Klaus-Michael Mangold: Impedance Spectroscopy . In: Chemistry in Our Time . tape 27 , 1993, pp. 134–140 , doi : 10.1002 / ciuz.19930270305 .
See also
Individual evidence
- ^ F. Kremer, A. Schonhals, W. Luck: Broadband Dielectric Spectroscopy. Springer, 2002, ISBN 3-540-43407-0 .
- ↑ AM Sidorovich: Dielectric Spectrum of Water. In: Ukrainian Physical Journal. 29, No. 8, 1984, pp. 1175-1181 (Russian).
- ^ AR Hippel: Dielectrics and Waves. John Willey & Sons, New York 1954.
- ↑ AA Volkov, AS Prokhorov: Broadband Dielectric Spectroscopy of Solids. In: Radiophysics and Quantum Electronics. 46, No. 8, 2003, pp. 657-665.


