Goods market
The goods market is seen in economics as a market on which goods and services are traded. In the goods market, supply and demand for goods meet.
Goods market in microeconomics
General
In contrast to the factor market in macroeconomics, the goods market in microeconomics consists only of individual goods and not of the totality of the goods of an economy. Therefore, only one specific goods market is considered. For example the market for flat screens. There may be further restrictions here. For example, flat screens with certain equipment features.
presentation
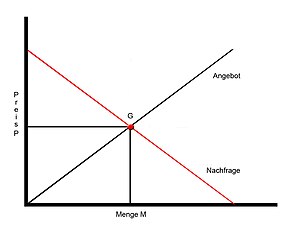
The above illustration shows the market equilibrium on the microeconomic goods market. Point G represents the market price where the quantity offered and demanded meet.
Effects of change
Several influences can cause changes in the microeconomic goods market. A practical example would be the decrease in the price of new products over time. If you take the flat screens again, you can see that a few years ago they were much more expensive. The demand was very high. The price was accordingly high, as the equilibrium in this market was shifted further upwards.
The following graphic shows this development
You can see the changed demand curve, which is shifted upwards and thus leads to a higher equilibrium price at G-0. If one imagines the development of the price for flat screens, this results in the following microeconomic scenario:
When this technology was still very new, demand was correspondingly higher, as hardly anyone owned such devices. The demand curve thus met the supply function at point G-0. Over time, however, the demand fell as more and more people owned such televisions. This shifted the demand curve downwards and led to a new equilibrium in G-1. There the price of the devices is obviously lower, as is the quantity produced. Of course, this example only works under the assumption of a constant supply function that does not adapt to consumer demand.
Goods market in macroeconomics
General
The goods market in macroeconomics includes all markets of an economy . Goods and services are traded on them, according to a definition of the European Commission goods and services; the sum of all markets is referred to here as product markets. In these markets the complete aggregated supply and the aggregated demand are combined. Supply includes all goods offered in an economy. Aggregate demand accordingly comprises the entire demand for goods in an economy.
There are basically different sizes that have a strong influence on the goods market. This would be the gross domestic product , for example .
Contents of the goods market in macroeconomics
Demand for goods
The demand for goods is calculated as follows:
- Z is the demand for goods, which results from the following components. On the one hand, there is consumption C. This depends on many factors, but of course most of all on income. Therefore the consumption is calculated from:
- Here, c0 is consumption if the disposable income (Y) were zero. In other words, the minimum consumption (an individual has to eat despite an income of zero). c1 continues to denote the marginal consumption rate (or propensity to consume). This represents how much of the disposable income is used for consumption purposes. A value of 0.6 for the consumption rate means, for example, For example, for every additional euro earned, 60 cents are used for consumption. However, the disposable income is reduced by the tax (T).
- I - Investments : The variable I is treated as exogenous . This means that it is given. It is true that companies invest more if their sales increase. z. For new machines, etc., but this variable is taken for granted in the model. Otherwise it would not be possible to correctly represent the changes in income in relation to the demand for goods, since every change in income and thus also in consumer behavior entails a change in investment.
- G - Government expenditure : Government expenditure is also taken for granted (exogenous). There are, however, various reasons for this, as government expenditure is not subject to any regularity.
- X - Exports: The variable X denotes the exports on the goods market.
- IM - imports: The variable IM denotes the imports on the goods market.
Supply of goods
The supply of goods is based on the calculated variables of the demand for goods. It is therefore dependent on the marginal consumption rate , income , investments and government spending as well as exports and imports . It does not behave constantly when it changes. It is a multiplier effect . If the production function as well as goods and factor prices are given and a company operates profit maximization , the profit-maximizing supply of goods can be determined. The company in perfect competition changed his supply of goods until the marginal revenues to marginal costs correspond:
- .
Marginal revenue is defined as the change in total revenue for sale of an additional unit , marginal cost is caused by the production incurred an additional unit costs.
presentation
The representation of the goods market can be done in three ways. On the one hand via a formal, on the other hand via a graphic and finally via a verbal analysis. For reasons of simplicity, the graphic analysis is used here.
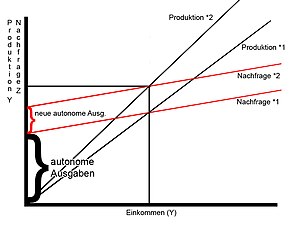
The figure above shows the demand and the production curve of a goods market in relation to income (Y). The demand function results from the formula: Z = (c0 + I + G - c1T) + c1Y. The first part describes the autonomous editions. So the expenses that have to be made in each case. Seen in this way, they describe the point of intersection with the Y-axis. The second part (c1 * Y) describes the increase in the function. As already described above, this represents the additional consumption when income increases. The production function, on the other hand, results from the calculated demand function! Because it runs through the intersection of the demand curve with income (Y) and starts at the origin of the coordinates.
Effects of change
Many changes can have an impact on this goods market equilibrium . A change in the autonomous expenditure is examined here. Here you can see that it increases production not by the same amount, but by a multiple! This multiplier effect can be clearly seen in the following graphic:
You can see here that the new production curve (production * 2) has a significantly higher rise than the originals. The difference between the two production lines increases with higher income.
literature
- Olivier Blanchard, Gerhard Illing, Macroeconomics , 2003, ISBN 978-3-8273-7051-8
- Sebastian Braun, "Macroeconomics Illustrated", 2007, ISBN 978-3-86707-492-6
- Rüdiger Dornbusch, Stanley Fischer, Richard Startz, "Macroeconomics", 2003, ISBN 978-3-486-25713-7
Individual evidence
- ↑ Product markets. European Commission, October 30, 2010, accessed July 24, 2015 .
- ↑ http://www.vernunft-schweiz.ch/glossar/51/G%FCtermarkt+.html , accessed on December 2, 2008
- ↑ http://www.vernunft-schweiz.ch/glossar/142/Aggregierter+Angebot+.html , accessed on December 2, 2008
- ↑ based on Blanchard, Illing, "Makroökonomie" see bibliography
- ↑ Horst Siebert / Oliver Lorz, Introduction to Economics , 2007, p. 203
- ↑ taken from Blanchard, Illing "Macroeconomics see bibliography"


