GNU debugger
| GDB
|
|
|---|---|
|
|
|
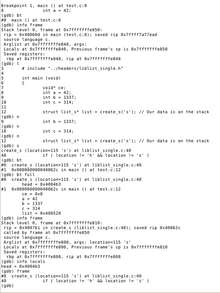
 Screenshot of the GNU debugger |
|
| Basic data
|
|
| developer | GNU project |
| Publishing year | 1986 |
| Current version |
9.2 ( May 23, 2020 ) |
| operating system | Unix derivatives (including Linux ), Windows |
| programming language | C , Scheme |
| category | Debugger |
| License | GPL |
| German speaking | No |
| gnu.org/software/gdb/ | |
The UNIX program GDB - the GNU Debugger - is the de facto standard debugger of Linux systems and was developed by the GNU project . It has been ported to many systems and supports the programming languages C , C ++ , Objective-C , FORTRAN , Java , Pascal , Modula-2 , Ada , D , Go and some others. GDB's interface is based on the debugger dbx , which originally comes from BSD- Unix and is now supplied as part of Oracle's Solaris Studio.
GDB offers the usual options for tracing, such as breakpoints or the output of the stack trace , and enables intervention in the execution of programs. GDB enables users, for example, to manipulate the program's variables or to call functions independently of the normal program sequence. As of version 7.0, tracing is not only possible forwards, but also backwards ( reverse debugging ). In addition, GDB can be automated with Python and GNU Guile .
The debugger does not have its own graphical user interface , but uses the standard input / output with GNU readline , which can optionally be supplemented by a TUI based on the curses library . There are also some graphical debugging surfaces that use the GDB as a backend, for example the Eclipse plug-in C / C ++ development tools , the ddd , the ncurses -based cgdb, gdbgui in the web browser, Insight or Emacs in " GUD mode " . Also Xcode used the GNU debugger. As of Xcode version 5, GDB is no longer officially supported by the OS X development environment.
Some other tools work with GDB, such as: B. Memory leak detectors.
GDB supports or supported the following architectures, among others:
- alpha
- POOR
- Atmel AVR
- Analog Devices Blackfin
- H8 / 300
- System / 370 , System / 390 and System z
- x86 and x86-64
- IA-64 "Itanium"
- Motorola 68000
- MIPS / MIPS64
- PA-RISC
- PowerPC (32- and 64-bit)
- SuperH
- SPARC
- VAX
- Cell
literature
- Richard M. Stallman , Roland Pesch, Stan Shebs et al .: Debugging with GDB . Free Software Foundation , 2011, ISBN 978-0-9831592-3-0
- Norman Matloff, PJ Salzman: The Art of Debugging with GDB, DDD, and Eclipse . No Starch Press, 2008, ISBN 978-1-5932717-4-9
Web links
- GDB homepage
- GDB Wiki
- Debugging with GDB . (PDF; gzipped; 2.0 MB) Documentation
- Using GNU's GDB Debugger Tutorial by Peter Jay Salzman
Individual evidence
- ^ Richard Stallman lecture at the Royal Institute of Technology, Sweden (1986-10-30) . (accessed on October 9, 2019): " Then after GNU Emacs was reasonably stable, which took all in all about a year and a half, I started getting back to other parts of the system. I developed a debugger which I called GDB which is a symbolic debugger for C code, which recently entered distribution. Now this debugger is to a large extent in the spirit of DBX, which is a debugger that comes with Berkeley Unix. "
- ↑ Joel Brobecker: GDB 9.2 released! . May 23, 2020 (accessed May 29, 2020).
- ↑ 15.4 Supported Languages
- ^ Reverse Debugging with GDB . Retrieved January 20, 2014.
- ↑ cgdb on github
- ↑ gdbgui on gdbgui.com, accessed April 20, 2019.
- ↑ http://blackfin.uclinux.org/doku.php?id=debuggers
