Size exclusion chromatography
The size exclusion chromatography (also gel permeation chromatography , GPC) is a form of liquid chromatography in which molecules of dissolved substances because of their size (more precisely, its hydrodynamic volume ) can be separated. Other terms are Size Exclusion Chromatography (SEC) and, from a physical point of view incorrectly, also Gel Filtration Chromatography (GFC) or Molecular Sieve Chromatography .
principle
The separation effect is not based on a filtration process , but on different available diffusion volumes for molecules of different sizes. The porous polymers of the stationary phase allow smaller molecules to penetrate, which significantly increases the diffusion volume available to them and thus extends the retention time . Small molecules are therefore retained more strongly than large ones, to which only gaps between the polymer granulate are accessible. The larger molecules therefore flow faster through the chromatography column . Therefore, large molecules are in the earlier fractions of the eluate while smaller molecules elute later. A sample with molecules of different sizes is now eluted. Very large and very small molecules cannot be separated. All molecules that do not fit into the pores elute at the very beginning, and molecules that fit very well into all pores at the very end. This makes the method a comparatively fast process for isolating larger molecules.
Stationary phase
As a rule, porous polymers in powder form are used as the stationary phase. The separation properties of cross-linked dextran were discovered in 1957 by Jerker Porath . The separation columns are filled with powdery particles of a hydrophilic , porous and cross-linked material, e.g. B. A with epichlorohydrin cross-linked dextran ( Sephadex ), an uncrosslinked or with 2,3-dibromopropanol -crosslinked agarose ( Sepharose or Sepharose CL ), a dextran methylenebisacrylamide copolymer ( Sephacryl ), a methacrylate - ethylene glycol - copolymer ( Toyopearl ) or Silica gel and other silicates. The diameter of the particles is in the range of approx. 3–35 µm. The particles of this opaque gel have a highly porous surface and, depending on the molecular size to be separated, varying pore sizes of approx. 60–2000 Å ; (6-200 nm).
To separate molecules with a molar mass between 5 and 150 kDa , average pore sizes around 12.5 nm are used, while pore sizes of around 25 nm are used for molecules between 10 and 500 kDa and pore sizes of 45 nm for molecules between 20 and 10,000 kDa.
Separation columns
A general distinction is made between two types of columns: the so-called single porosity columns and the linear columns , which are also called mixed-bed columns . The single porosity columns have pores with a very small pore size distribution. They separate very well in a certain size range. In order to achieve a separation over a larger molar mass range, three to four separation columns with different pore sizes are often connected in series. In the mixed-bed columns, the column material has already been mixed by the manufacturer so that all pore sizes are represented, from very small to large pores. These columns separate over a large molar mass range and very linearly with the hydrodynamic volume . The separation performance of a mixed-bed column is therefore limited, so that here too two to three separation columns are combined in series for good separation. Nowadays the mixed bed columns dominate. The single-porosity columns are definitely justified for special applications.
Construction of a GPC machine
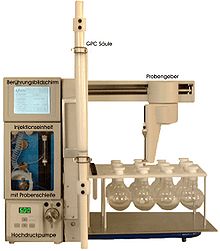
The essential components of an automated GPC system are the pump, injection system, separation columns and various detectors. The pump draws in the solvent and creates a constant flow through the entire system. Often the solvent is sucked through an inline degasser , which removes dissolved gases. After the pump, there is the injection system for sample application, either manually or an autosampler. In the following separation column, the sample is separated based on its hydrodynamic radius. The different detectors then deliver certain information depending on the type. Ultimately, the entire river (including the sample) ends up in a waste container. The flow (the eluate) can also be collected in individual vessels, which is called fractionation (preparative GPC).
Detectors
The different detection variants ( refractive index , light in the UV / VIS range, viscosity, light scattering, electrical conductivity, radioactivity ...) must be carefully calibrated to the respective polymer type. So-called concentration detectors such as refractive index detectors and UV detectors (depending on the UV activity of the polymer to be analyzed) are used as detectors . With these detectors, the peak area increases proportionally with the concentration, which enables a substance to be quantified. With the classic GPC, only this type of detector is used and the system is calibrated with standard substances to determine the molecular masses.
Under the synonym of molar mass sensitive detectors continue to find viscosity detectors and light scattering detectors used. This type of detector can only be used in combination with concentration detectors, because the concentration is always required for calculating molar mass. In particular, the light scattering can determine the molecular mass mean values (M n , M w , M z ) and the radius of gyration directly , independently of polymer standards . A distinction is made here above all between multi-angle ( MALS ), small-angle ( LALS ) and right-angle light scattering detectors ( RALS ). With the viscosity detector, the parameters K and α of the Mark-Houwink equation , a universal calibration and statements about the conformation of the polymer can be made.
Infrared detectors and fluorescence detectors are also used , but are limited to special applications.
Conventional calibration
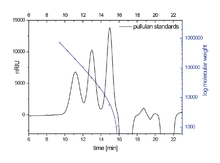
The conventional calibration is only used when using a concentration detector (RI or UV). Several polymer standards of different sizes with low polydispersities are usually used for calibration. The calibration curve can be created from the specified molecular masses of the standards and the retention time obtained after analysis. With the help of the calibration curve, the molecular mass of unknown samples can now be determined. The result is relative molar masses based on the standard substance. Since narrowly distributed standards are not available for every polymer, the molecular weight calculation can be problematic when using different standards. Although standards that are as "similar" as possible are used in such cases, the molar mass calculation can differ dramatically from the real one. A much safer method here would be to use a direct method such as B. the light scattering.
Universal calibration
GPC using a concentration detector (RI or UV) in conjunction with a viscosity detector. For calibration polymer standards are used with low polydispersities, and a calibration curve log (intrinsic viscosity molecular weight x) set up. Since the product of (molar mass × intrinsic viscosity) is proportional to the hydrodynamic radius, the real or absolute molar masses can be calculated.
Light scattering detection
By using a light scattering detector, there is no need to set up a calibration curve. A light scattering detector indirectly measures the absolute molecular mass. A concentration detector is also required for evaluation. The equation established by John William Strutt, 3rd Baron Rayleigh describes the relationship between the scattered light intensity, which is expressed by the so-called Rayleigh ratio R (θ), the polymer concentration c and the weight-average molar mass M w . Here, K is an optical constant and A 2 is the second virial coefficient.
Molecular weight determination
By comparing the retention time or the elution volume of a molecule with an unknown molar mass with the retention times or elution volumes of molecules of known molar mass ( comigration standard ), a molar mass can be determined by comparison with the generated graph or arithmetically using a regression analysis . In the case of proteins, a determination of the molar mass only makes sense for proteins with similar protein folds (i.e. by comparing globular proteins with one another or fibrillar proteins with one another), since the shape of the molecules affects the speed of migration. In the case of proteins, the molecular weight is therefore more likely to be determined by denaturing SDS-PAGE or mass spectrometry .
Applications
Typical application is the separation ( polymer fractionation ) of any kind of macromolecules , such as synthetic polymers or biopolymers (e.g. polysaccharides , DNA , RNA and proteins ). After a suitable calibration, the distribution curve of the molar mass is obtained from the elution curve , with which the different weighted mean molar masses (M n , M w ...) and the polydispersity of the sample can then be calculated. Field-flow fractionation (FFF) has increasingly established itself as an alternative method for the separation of macromolecules .
precision
For the gel permeation chromatography of synthetic polymers are ring test sdaten available. Assuming an organic phase and classic detectors (RI, UV), the relative standard deviation s R, rel of the weight average M w is around 8 to 10%. It can be reduced considerably by linking the measured variable to a defined set of reference substances. Somewhat higher s R, rel values result for the number average M n . Here it is important to agree exactly how the baseline is to be laid. s R is a good estimate of the standard measurement uncertainty u .
Alternative methods
Problems often arise in gel permeation chromatography as a result of the interaction with the stationary phase, particularly with macromolecules, nanoparticles and agglomeration. Clogging of the column, absorption of agglomerates and degradation of the molecules due to shear forces in the column are problems frequently described. Due to the separation in the open flow channel without a static phase, these effects are avoided in field-flow fractionation (FFF).
literature
- Friedrich Lottspeich, Haralabos Zorbas: Bioanalytics . Spektrum Akademischer Verlag, Heidelberg 1998, ISBN 978-3827400413 .
- Hubert Rehm, Thomas Letzel: The Experimenter: Protein Biochemistry / Proteomics . 6th edition, Spektrum Akademischer Verlag, Heidelberg 2009, ISBN 978-3827423122 .
Web links
Individual evidence
- ↑ Jerker Porath , Per Flodin: Gel filtration: a method for desalting and group separation. In: Nature (1959), Vol. 183 (4676), pp. 1657-9. PMID 13666849 .
- ↑ J. Porath: Gel filtration of proteins, peptides and amino acids. In: Biochim Biophys Acta (1960), Vol. 39, pp. 193-207. PMID 14434211 .
- ^ P. Andrews: Estimation of the molecular weights of proteins by Sephadex gel filtration. In: Biochem J. (1964), Vol. 91 (2), pp. 222-33. PMID 4158310 ; PMC 1202876 (free full text).
- ^ J. Porath: From gel filtration to adsorptive size exclusion. In: J Protein Chem. (1997), Vol. 16 (5), pp. 463-8. PMID 9246630 .
- ↑ Bruno Wampfler, Samuel Affolter, Axel Ritter, Manfred Schmid: Measurement uncertainty in plastics analysis - determination with round robin test data . Hanser, Munich 2017, ISBN 978-3-446-45286-2 , pp. 78-83 .


