Parabolic template
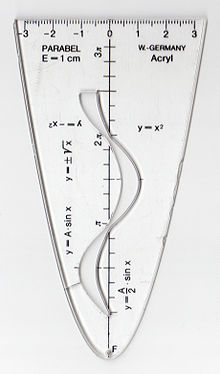
A parabolic template is a curve ruler that allows you to create a series of function graphs. This is easier and more accurate than setting up a table of values, drawing in the points and then connecting the points by hand. In addition to the ruler , the set square with integrated protractor and the compass, the parabolic template is one of the most important aids in middle school mathematics. The units of length in centimeters on the template usually correspond to two units of length on the checked booklet .
Parabolic stencils are usually made of acrylic glass , but you can also make them yourself from cardboard. In the copies available for sale, a template for the sine function , sometimes also for the cosine and tangent functions, is integrated.
Draw the normal parabola
Parabola templates allow you to draw parabolas that are congruent to the normal parabola . To do this, the vertex of the quadratic function must be known or calculated.
A parabola is drawn in the following steps:
- Determine the vertex shape
- Find the vertex
- Draw the coordinate system
- Place the template at the vertex
- Draw a parabola
- Review of the drawing
Find the vertex
One has a quadratic function of the normal parabolic type of the form
so one must first transform this functional equation into the vertex form:
You can read off the vertex directly from it .
The function becomes for this in the form
convicted. If this formula seems too complicated, students can gradually complete the square .
The vertex then reads
Interpretation of the variables and
The orientation of the template up or down and the displacement of the vertex from the coordinate origin depends on the variables and .
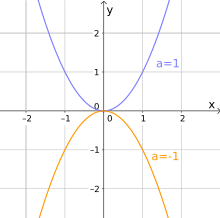
- If , therefore, is positive, the parabola is open upwards, with downwards.
- Dealing with the variable is prone to errors because there is a minus sign in front of the in the vertex form . If it is itself negative, the parabola is shifted by the amount from to the left, otherwise to the right.
- The variable indicates the shift of the template up or down.
Review of the drawing
After drawing the parabola for the function , the result can be checked at the axis intersections:
- Is the intersection of the parabola with the -axis at the point ?
- Are the zeros , if any, in the right places on the axis?
Draw further function graphs
Inside the template there are usually punched out curves for drawing the graphs of trigonometric functions . A cosine curve can also be drawn with a punched out sine curve by shifting the template by units in the negative direction.
You can also draw the graph of the square root function . To do this, tilt the template to the right so that the opening of the template points in the direction of the positive x-axis. Now ignore the lower part and draw along the upper part of the template. The fact that one can use the same template for the parabolic and square root functions is due to the fact that (with suitable restriction of the value ranges) one is the inverse function of the other.
Methodical criticism
The parabolic stencil is more developed as a drawing device than the devices of the classic Euclidean construction with compass and ruler . Among other things, this contradicts the concept of dynamic geometry . The knowledge and skills that are required to create a parabola are no longer practiced, parts of the construction are skipped and thus drawing without thinking is possible.
On the other hand, since the widespread introduction of pocket calculators, tables of values and (with graphic pocket calculators ) graphs can be created and displayed automatically and conveniently. This partially eliminates the methodological reason for quickly creating images using the parabolic template in schools .
literature
- Hans-Georg Weigand , Thomas Weth: Computers in mathematics lessons. New ways to old goals. Spectrum, Heidelberg / Berlin 2002, ISBN 978-3-8274-1100-6 .
Web links
- Explanations of the didactic parabolic template Uni Halle
- Didactic parabolic template Uni Berlin (PDF; 1.2 MB)
- Video on Youtube
Individual evidence
- ↑ Weigand, Weth, 2002, p. 156f.


