
X-ray fluorescence analysis
The X-ray fluorescence analysis (XRF), and X-ray fluorescence spectroscopy (RFS) called ( English X-ray fluorescence spectroscopy , XRF spectroscopy ) is a method from the material analysis on the basis of X-ray fluorescence . It is one of the most frequently used methods for the qualitative and quantitative determination of the elemental composition of a sample, since the samples are not destroyed by the measurement and no digestions are required. It is particularly widely used in the metalworking industry, in the analysis of glass, ceramics and building materials, and in the analysis of lubricants and mineral oil products. The detection limit is around one microgram per gram ( ppm ).
It goes back to attempts by Richard Glocker (1890–1978) and Hans-Wilhelm Schreiber in 1929.
Summary description
In X-ray fluorescence analysis, the technique of fluorescence spectroscopy is applied to X-rays . The material sample is either excited by polychromatic X-rays, gamma or ion radiation (excitation with electron beam → EDX ). Electrons close to the nucleus are knocked out from the inner shells of the atom. This allows electrons to fall back from higher energy levels. The energy released is given off in the form of element-specific fluorescence radiation. This fluorescence radiation can be evaluated by a radiation detector . The X-ray fluorescence analysis enables the identification and determination of the concentration of all elements from atomic number Z = 5 (boron) (i.e. not: H (hydrogen), He (lium), Li (thium) and Be (ryllium)) in the most varied of compositions. The detection of minor impurities, such as heavy metals, which have a high atomic number, is particularly effective. The most important alloying element for steel, carbon, can only be detected with great effort.
XRF measurement method
There are various methods with regard to excitation and evaluation that are optimized for different purposes. Due to the underlying complexity, the following list of some XRF measurement methods can unfortunately never be completely complete and will therefore only provide an overview of a few important methods.
Quantification formula:
![{I _ {{E _ {{i, {\ mathrm {fl}}}}}} (x) = \ int _ {0} ^ {{x}} {\ mathrm {d}} x'I _ {{E_ { 0}}} \ cdot \ underbrace {\ exp \ left [- {\ frac {\ mu _ {{i, E_ {0}}}} {\ sin \ psi _ {{\ mathrm {in}}}}} \ \ rho _ {i} \ x '\ right]} _ {{{\ text {Attenuation of the incident radiation}}}} \ cdot \ underbrace {\ left (\ tau _ {{i, E_ {0}}} \ omega _ {{X_ {i}}} g _ {{l, X_ {i}}} {\ frac {j _ {{X_ {i}}} - 1} {j _ {{X_ {i}}}}} \ rho _ {i} {\ frac {1} {\ sin \ psi _ {{\ mathrm {in}}}}} \ right)} _ {{{\ text {probability of photon formation}}}} \ cdot \ underbrace {\ exp \ left [- {\ frac {\ mu _ {{i, E _ {{i, {\ mathrm {fl}}}}}}}} {\ sin \ psi _ {{\ mathrm {out}} }}} \ rho _ {i} \ x '\ right]} _ {{{\ text {Damping when leaving the sample}}}} \ cdot {\ frac {\ Omega _ {{\ mathrm {Det}}} } {4 \ pi}} \ cdot \ varepsilon _ {{{\ mathrm {Det}}, E _ {{\ mathrm {fl}}}}}}](https://wikimedia.org/api/rest_v1/media/math/render/svg/2463cdb2ed551ac8c27e61b97017d2ec45abe78d)

in which:
- Intensity of the measurable fluorescence radiation of the element with the photon energy
- Intensity of the incident radiation with the photon energy
- Absorption coefficient of the element at the photon energy
- Angle of incidence of the exciting radiation
- Density of the element
- Photoelectric absorption cross-section of the element for a photon of energy


- Fluorescence yield of the absorption edge
- Transition probability of the fluorescence line belonging to the absorption edge
- Jump ratio (Engl. Jump ratio ) of the absorption edge


- Absorption coefficient of the element at fluorescence energy ;
- Angle of observation / angle in which direction the detector is located (often the detector is located vertically above the sample → )
- effective solid angle of the detector
- Detector efficiency in terms of photon energy


Note: In general, it is because the fluorescent radiation and not the reflected beam is used to obtain information. It is true that information about the sample can also be obtained by means of the reflected beam. But this is more ellipsometry and not explicitly fluorescence radiation.

Total reflection X-ray fluorescence analysis (TRFA, TXRF)
In the total reflection X-ray fluorescence analysis (TXRF, engl. Total reflection x-ray fluorescence , TXRF) of the stimulating ray is at a very shallow angle of incidence of a few minutes of arc on the sample refractive index irradiated <1, so that there is total internal reflection occurs. The resulting penetration depth of a few nanometers creates a better signal-to-noise ratio , as there is no interaction with the sample carrier material. The detection limit can thus be extended to 0.01 picograms . Furthermore, the interaction of the incident with the reflected X-rays forms standing wave fields ( x-ray standing waves , XSW), which can be used in particular for the detection and quantification of impurities on the sample (e.g. a wafer ).
X-ray fluorescence analysis under grazing incidence (GIXRF)
This is X -ray fluorescence analysis under grazing incidence ( English grazing-incidence x-ray fluorescence , GIXRF). This method is closely related to TXRF, but differs, among other things, in that with GIXRF the angle of incidence is varied around the area of the critical angle of total reflection . Below the critical angle, it is basically the classic TXRF method, but if the angle of incidence exceeds the critical angle , the radiation penetrates the layer below with an increasing angle. In addition, the standing wave fields of X -ray radiation ( x-ray standing waves , XSW) known from TXRF are also formed with GIXRF , which leads to a modulation of the excitation radiation in the area of the interface. This also makes it possible to learn something about the nature of the boundary layer or to determine the elemental composition of a layer or sample depending on the depth.

This method is used for layer systems whose layers differ significantly in terms of their refractive index . This applies, among other things, to solar cells . Due to the different refractive index, the critical angles of the individual layers also differ . If the critical angle of an upper layer is greater than the critical angle of an underlying layer, then there is an angle range in which the X-ray light penetrates the upper layer but does not reach the layer underneath due to total internal reflection. A large part of the totally reflected radiation then overcomes the boundary of the sample and exits the upper layer again. There it is superimposed with the part of the radiation that was reflected on the uppermost surface of the sample. From the resulting interference in the total reflected X-ray light, one can infer the thickness of the irradiated layer.


Micro X-ray fluorescence analysis (μ-RFA, μ-XRF)
In the micro X-ray fluorescence analysis (μ-RFA, engl. Micro x-ray fluorescence , μ-XRF) is a process in which the X-ray beam is focused on a few micrometres by means of X-ray optics, in order thus to obtain a resolution in the micrometer range.
An extension of this method to 3D micro-X-ray fluorescence spectroscopy (3D-μ-XRF, 3D-μ-XRF), which was only developed in the 2000s at the TU Berlin , allows samples to be scanned in three dimensions (3D) non-destructively. Both the excitation and the detection beam are each passed through an X-ray lens (so-called polycapillary lens), which defines an examination volume measuring only a few cubic micrometers.

X-ray absorption spectroscopy (XAS)
A further group of analysis methods, the X-ray absorption spectroscopy (engl. X-ray absorption spectroscopy , XAS). It includes methods in which the absorption is measured by X-ray radiation in the range of an absorption edge. Since the fine structure of the spectrum obtained is usually analyzed, this group of methods is also known as X-ray absorption fine structure spectroscopy ( XAFS spectroscopy ). Basically, this group is divided into the investigation of the “near edge” (NEXAFS / XANES) and the investigation of the “extended edge structure” ( EXAFS ).
The X-ray near-edge fine structure spectroscopy ( near-edge x-ray absorption fine structure , NEXAFS) or ( X-ray absorption near-edge structure , XANES) is a process that determines the absorption edge of an element examined in high resolution, which is why the term absorption is justified. Occasionally this leads to the incorrect assumption that it is pure absorption spectroscopy.
In the EXAFS (of English. Extended X-ray absorption fine structure , EXAFS) is a method that considers the "extended area" of the absorption edge, d. H. the X-ray absorption fine structure remote from the edge. When examining molecules on surfaces, this method is also known as SEXAFS ( surface extended X-ray absorption fine structure ).
In both cases there is interference (arrows), which provide the basis for quantitative investigations in NEXAFS / XANES or EXAFS measurements. For example, the frequency of the oscillations can be traced back to the distance to the neighboring atoms. Both methods are used both in "absorption mode", ie in transmission, and in "fluorescence mode". However, since only thin sample systems are transmissive, i.e. permeable, this method is usually operated in fluorescence mode and thus also belongs to the group of X-ray fluorescence analysis (XRF).
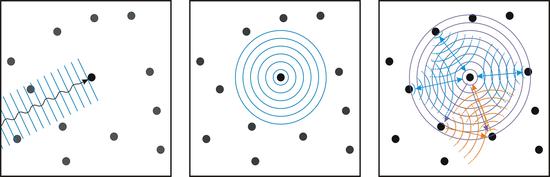
Left: The incident plane wave is absorbed by an atom. Middle: The absorbing atom in turn emits a spherical photoelectron wave. Right: The emitted photoelectron wave is scattered by the surrounding atoms. On the one hand (blue) there are single scattering processes that are the cause of the EXAFS structures, on the other hand (orange) there are also multiple scattering processes that are the cause of the NEXAFS / XANES structures.
Detection types
In the case of XRF, there are basically two types of detection to be distinguished
- The energy-dispersive detection of fluorescence (EDXRF) and
- the wavelength-dispersive detection of fluorescence (WDXRF).
Energy dispersive X-ray fluorescence analysis (EDXRF)
In the energy dispersive X-ray fluorescence (EDXRF, engl. Energy dispersive X-ray fluorescence , EDXRF) is reached, the excitation of the sample by X-rays. To excite certain desired elements or to suppress background noise, filters made of different elements can be connected between the X-ray source and the sample. An energy-dispersive detector measures the energy of the emitted fluorescence quanta , similar to the EDX .
Wavelength dispersive X-ray fluorescence analysis (WDXRF)
In the wavelength-dispersive X-ray fluorescence (WDXRF, engl. Wavelength dispersive X-ray fluorescence , WDXRF), the excitation just like the EDXRF. The difference lies in the detection and evaluation of the emitted fluorescence radiation: These are aligned in parallel by a collimator , bent in an analyzer crystal and registered by a suitable detector. The crystal serves to split the spectrum of the polychromatic secondary radiation emanating from the sample into wavelengths by means of diffraction and to enable the qualitative determination of the element based on the diffraction angle of the X-ray radiation and a quantitative determination by measuring the intensity of the X-ray radiation.
Comparison EDXRF / WDXRF
Since the wavelength of an X-ray quantum is inversely proportional to its energy, it would be expected that the results of EDXRF and WDXRF would be identical except for a reflection of the spectrum. In fact, there are some significant differences due to the different design:
The energy resolution describes the sharpness of separation between two spectral peaks. It is usually given for the X-ray energy of 5.9 keV (Manganese-K-alpha line, Mn-K-α line). The resolution of a WDXRF system depends on the crystal and the design of the optics. Resolutions of 20 eV to 5 eV can be achieved. In contrast, the resolution of an EDXRF system only reaches values of 600 eV to 120 eV. This means that a WDXRF system is much more accurate, so that peaks that are close together can still be separated. However, the high-precision crystals and optics are expensive and prone to errors. In addition, WDXRF systems require significantly longer measurement times.
The efficiency describes how well the X-rays from the X-ray source are used to excite the sample and emit X-rays there. This factor essentially determines the performance of the X-ray source and is therefore one of the central cost factors. The WDXRF is clearly at a disadvantage here, as almost no energy is lost with the EDXRF with direct excitation, whereas with the WDXRF almost a hundred times the power has to be used in order to achieve the same yield of X-ray quanta.
The EDXRF is a much more cost-effective variant, which, however, also offers a significantly lower energy resolution, so that depending on the application, a decision has to be made as to which design is more suitable.
Components
Radiation source
The following instruments can be used as the radiation source
- an x-ray tube .
- Side window tube. An anode made of chromium , tungsten , molybdenum , gold or rhodium is bombarded with an electron beam. A lot of heat and X-rays are generated, which leave the X-ray tube through the beryllium windows on the sides.
- An end-window tube is used far more frequently because of the better radiation density. The anode is located opposite the beryllium window and the cathode is built up in a ring around the anode. If a voltage is applied, the electrons move on a curved path to the anode.
- Radioactive nuclides. For portable spectrometers, primary radiators such as iron ( 55 Fe) or plutonium ( 238 Pu) can be used instead of an X-ray tube . However, the detection limits are very high here.
- a synchrotron radiation source .
filter
If an X-ray tube is used as the radiation source, the generated X-ray radiation consists on the one hand of bremsstrahlung and on the other hand of a characteristic line spectrum of the bombarded anode material. If, for example, chromium is used as the anode material, the characteristic line spectrum of chromium will also be detected at the end. It cannot be distinguished whether the line spectrum only comes from the X-ray tube or whether the sample also contains chromium. A selective filter is therefore placed between the tube and the sample in order to absorb the characteristic K beta and K alpha lines. The material of the selective filter is chosen so that its atomic number is one or two smaller than the element of which the anode is made. For example, a titanium filter (ordinal number 22) is used for a chrome tube (ordinal number 24).
Split system
Both thin tubes ( collimators ) and metal lamellas ( Soller diaphragms ) can be used as the slit system. Its purpose is to select a parallel beam from the divergent radiation.
Analyzer crystal
In order to be able to analyze the fluorescence lines of the X-ray radiation later, it must first be diffracted on a regular grid. Single crystals such as LiF single crystals or multilayer mirrors are suitable as diffraction grids for X-rays. Bragg equation

in which:
- n the diffraction order;
- d is the grid spacing;
- θ the glancing or Bragg angle;
- λ denote the wavelength. The longest measurable wavelength λ max is obtained by inserting θ max = 90 °.
Corrected Bragg equation for multilayer mirrors:

in which:
- δ the dispersion of the layer materials involved
Scintillation counter
Scintillation counters are used for elements with a higher atomic number than iron (26 protons) and usually consist of a NaI crystal which is doped with thallium. When the X-rays hit the crystal, the X-rays are converted into fluorescent radiation. The fluorescent radiation is converted into electrical impulses in the downstream photomultiplier and amplified many times over.
Counter tube
Counter tubes are used to measure longer-wave radiation emitted by the lighter elements beryllium (4 protons) to manganese (25 protons). A counter tube is filled with an inert gas (for example argon). When X-rays hit an argon atom, it knocks out a photoelectron. This photoelectron migrates to the wire anode and on the way there generates up to 10,000 electron-ion pairs (gas amplification) through secondary impact ionization. The return of the positive ions to the meter wall causes a brief (microsecond) disturbance of the electrical field, which then generates a current / voltage pulse at the preamplifier. The height of this pulse is proportional to the radiated energy of the X-ray quantum (cf. proportional counter - in contrast to the Geiger counter, in which the information about the energy is lost).
Application in practice
Limits of the method
X-ray fluorescence analysis cannot be applied to elements lighter than boron (atomic number 5). Reasonable analysis values are only from fluorine (atomic number 9) (in between are: C (carbon), N (nitrogen), and O (oxygen)), good values only from sodium (atomic number 11) (in between Ne (on) (atomic number 10) ) possible, since the X-rays of the lighter elements are so easily absorbed that they cannot even penetrate the detector. The quantitative upper limit results from the respective reference samples (see calibration ).
Type and shape of the sample to be analyzed
Solid samples are generally analyzed. Liquids are analyzed in a plastic jar with a bottom made of a thin film. Usually solid specimens are used, which have the shape of a round disc (similar to a large coin) with a diameter of 2 to 5 cm. The sample must have at least one flat surface from which the X-rays can be reflected.
Sample preparation
The easiest way to analyze metal disks. Powdery samples must first be finely ground and pressed together with a binding agent (for example paraffin wax or cellulose powder) to form a sample tablet. Another possibility is the mixing of rock powder etc. with lithium tetraborate and the production of a vitreous melt which is poured into a casting mold. In this process, the sample is of course destroyed.
Powder tablets for the analysis of rock powders, cement, slag, fly ash
3 grams of the test substance are mixed with 0.6 grams of paraffin wax powder and pressed in a tablet press. More stable tablets are achieved with 2 grams of boric acid if the sample mixture is applied and a tablet is pressed from it. The substance is located on the boric acid layer, which has better flow properties under pressure.
Meltable tablets for the analysis of rock powders, cement, slag
Better measurement results are achieved with orodispersible tablets. To do this, one part by weight of 1 to 2 grams of the rock powder and five parts of 5 to 10 grams of dilithium tetraborate (Li 2 B 4 O 7 ) are thoroughly ground in an agate mortar and mixed in this way, then placed in a platinum crucible. The contents of the crucible are heated in an electric furnace to 1050 to 1080 ° C for at least 12 minutes and the liquid melt is transferred to a casting mold above the Bunsen burner. This melt in the casting mold is cooled with compressed air so that the melt does not crystallize between 1000 ° C and 600 ° C. Cements are only cooled to a faint red heat, after which they are cooled down more slowly to prevent the tablets from breaking. A small amount of lithium iodide (20 mg) is added two minutes before pouring to prevent the tablet from sticking to the casting mold, which causes the tablet to burst. If the sample substance is low, 250 mg sample with 7.25 g lithium tetraborate can be made up.
Oven goggles, long crucible tongs and protective gloves are required when pouring the tablets to protect against thermal radiation. When adding lithium iodide, iodine vapors are produced, so the furnace should be under a hood.
There are also automatic digestion devices for melt tablets that produce up to 6 melt digestions at the same time.
Detection limits in orodispersible tablets
A mixing ratio of 1 + 59 is used. Achievable minimum detection limits are at least:
- Na, Mg: 100 ppm
- Al, Si, P, S: 50 ppm
- K, Ca, Ba, Ti: 30 ppm
- Fe, Mn, Cr, Ni, Cu, Zn: 10 ppm
- Rb, Sr, Y, Zr, Nb: 6 ppm
The detection limit of powder tablets is better by a factor of 2 to 3, but due to particle size effects and poorer homogeneity of the samples, the accuracy of the analyzes is lower and the tolerances are greater.
Calibration of the X-ray fluorescence device
Calibration samples of known content are used, which are either produced by yourself or standard samples that you can buy , the contents of which have been determined by many renowned laboratories. Three calibration methods are calibration using external standards, internal standards or standard addition, whereby the internal standard method is usually used in X-ray fluorescence analysis. In the meantime there are also instruments that (with lower accuracy) can do without calibration samples.
Analysis when buying gold
Due to the steady rise in the price of gold and the growing market for precious metals, the RF analysis is also used more and more in the area of gold buying. In contrast to the conventional line / acid method, the fineness of the sample can be analyzed non-destructively. Samples of unknown composition with a large number of accompanying elements can thus be correctly determined. This means that fraudulent objects with a forged fineness stamp are also detected. The RF analysis thus offers more transparency than conventional analyzes, but unfortunately has the disadvantage of only superficial determination of the composition. An exact analysis in depth of a sample is not possible. There are no limits to possible fraud here either. Destruction of the sample is essential for a correct analysis. A non-destructive gold analysis, however, is possible by measuring the ultrasonic speed .
Analysis of works of art
RF analysis has also been used with success in the analysis of paintings. In recent times, miniaturized analysis devices have become available which allow on-site analysis. When using larger scan analysis devices, the distribution of individual chemical elements in the painting can be mapped and thus the pigments used can also be identified. During the investigation of Rembrandt's portrait of a man in military costume, an underlying overpainted portrait of a man was discovered using XRF and neutron activation analysis . An overpainted female portrait could also be made visible under the surface layers when examining the painting "Grass" by Vincent van Gogh .
literature
- R. Tertian, F. Claisse: Principles of quantitative X-ray fluorescence analysis. Heyden & Son, 1982, ISBN 0-85501-709-0 .
- BK Agarwal: X-Ray Spectroscopy: An Introduction. Springer, 1991, ISBN 0-387-09268-4 .
- R. Klockenkaemper: Total-Reflection X-Ray Fluorescence Analysis. John Wiley & Sons, 1996, ISBN 0-471-30524-3 .
- R. Van Grieken, AA Markowicz: Handbook of X-Ray Spectrometry. Marcel Dekker, 2002, ISBN 0-8247-0600-5 .
- B. Beckhoff et al. a .: Handbook of Practical X-Ray Fluorescence Analysis. Springer, 2006, ISBN 3-540-28603-9 .
- Georg Schwedt: Analytical chemistry: Basics, methods and practice. Wiley-VCH, 2008, ISBN 978-3-527-31206-1 .
- H. Erhardt: X-ray fluorescence analysis, applications in company laboratories. German publishing house for basic industry, Leipzig 1988, ISBN 3-342-00219-0 .
- Paula Hahn-Weinheimer , Klaus Weber-Diefenbach, Alfred Hirner: X-ray fluorescence analytical methods, basics and practical application in geology, materials and environmental sciences. Springer-Verlag, 2000, ISBN 3-528-06579-6 .
Web links
- European X-ray Spectrometry Association - interesting links
- X Ray Fluorescence at ColourLex
- XRF at terrachem - interesting link
Individual evidence
- ↑ DA Skoog, JJ Leary: Instrumental Analytics Basics - Devices - Application 1992. Springer Verlag, Berlin, p. 410.
- ↑ Burkhard Beckhoff, Rolf Fliegauf, Michael Kolbe, Matthias Müller, Jan Weser, Gerhard Ulm: Reference-Free Total Reflection X-ray Fluorescence Analysis of Semiconductor Surfaces with Synchrotron Radiation . In: Analytical Chemistry . tape 79 , no. 20 , September 1, 2007, pp. 7873-7882 , doi : 10.1021 / ac071236p .
- ↑ P. Hönicke, B. Beckhoff, M. Kolbe, D. Giubertoni, J. van den Berg, G. Pepponi: Depth profile characterization of ultra shallow junction implants . In: Analytical Bioanalytical Chemistry . tape 396 , no. 8 , April 1, 2010, p. 2825-2832 , doi : 10.1007 / s00216-009-3266-y .
- ↑ Ioanna Mantouvalou: Quantitative 3D Micro X-ray fluorescence spectroscopy . 2009, urn : nbn: de: kobv: 83-opus-23153 (dissertation, Technical University Berlin, 2009).
- ↑ Manufacturer's website for UniQuant
- ↑ René Böttcher, Lothar Spieß: Determination of material parameters with ultrasonic methods - is the "gold bar" real? In: NDT in research, development and application / DGZfP annual conference on non-destructive material testing; 2014 (Potsdam): 26-28. May 2014. DGZfP, Berlin 2014 (7 pages).
- ↑ X Ray Fluorescence at ColourLex
- ↑ Karen Trentelman, Koen Janssens, Geert van der Snickt, Yvonne Szafran, Anne T. Woollett, Joris Dik: Rembrandt's An Old Man in Military Costume: the underlying image re-Examined. In: Applied Physics A. November 2015, Volume 121, No. 3, pp. 801-811.
- ↑ Joris Dik, Koen Janssens, Geert Van Der Snickt, Luuk van der Loeff, Karen Rickers, Marine Cotte: Visualization of a Lost Painting by Vincent van Gogh Using Synchrotron Radiation Based X-ray Fluorescence Elemental Mapping . In: Analytical Chemistry . tape 80 , no. 16 , August 2008, p. 6436-6442 , doi : 10.1021 / ac800965g .