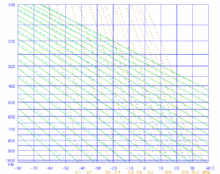
Stüve diagram
A Stüve diagram is one of four thermodynamic diagrams , often in weather analysis and - prediction are used. It was developed by the German meteorologist Georg Stüve around 1927 and quickly established itself in order to display the temperature and dew point measurements of radiosondes .
This diagram is simple in that it uses straight lines to represent the three primary quantities of pressure , temperature, and potential temperature . The isotherms are straight and vertical (unlike the emagram where they are inclined 45 °), the isobars are straight and horizontal, and the dry adiabats are also straight and tilt 45 degrees to the left, only the wet adiabats are curved. Wind arrows are often drawn on the side of the graph to show the winds at different heights. To save space, the same symbols are used as in weather maps . However, the use of this configuration of the axes sacrifices the property of the original Clausius-Clapeyron relationship that equal areas correspond to equal amounts of energy . It allows the analysis of the cloud layers and the stability of the atmospheric stratification, but does not allow the calculation of the convective available potential energy ( CAPE ). This is why the other three thermodynamic diagrams ( emagrams , tephigrams and Skew-T log-P diagrams) are often preferred, the latter especially in the USA .
