Cause and effect diagram
The cause-and-effect diagram is the graphic representation of causes that lead to a result or have a significant influence on it. All problem causes are to be identified and their dependencies shown. The most famous shape was developed by the Japanese scientist Kaoru Ishikawa in the early 1940s and was later named after him. The Ishikawa diagram was originally used in the context of quality management to analyze quality problems and their causes. Today it can also be applied to other problem areas and has spread worldwide.
Other tools in the study of cause-effect relationships are the cause-effect table (Engl. Cause and Effect Matrix ) or fault tree analysis (Engl. Fault Tree Analysis ).
Synonyms
The cause and effect diagram has several names. For one, the Ishikawa diagram is named after its inventor. Other very common names are herringbone diagram / fishbone diagram or fishbone diagram , as it looks like the bones of a fish to the viewer.
Creation of the cause and effect diagram
The procedure consists of five consecutive steps.
Draw a UW diagram and enter the main influencing factors
The starting point is a horizontal arrow pointing to the right, at the tip of which is the goal or problem formulated as succinctly as possible, for example our customer service is bad . The arrows of the main influencing variables that lead to a certain effect meet at an angle. An arrow means … contributes to the fact that… .
Original main influencing variables, such as the 4M ( material , machine , method , human ) or 8M (expanded to include management , environment (milieu), measurement and money) are now being replaced by all other necessary influencing variables (e.g. processes , Environment etc.) added.
Work out main and secondary causes
Potential causes are explored using creativity techniques. These are shown in the form of smaller arrows on the line of the respective main influencing variables. If there are other underlying causes, you can branch further; this results in ever finer ramifications.
Check for completeness
Check that all possible causes have really been considered. By visualization , it is often easier to find other causes.
Selection of probable statements
Potential causes are weighted according to their importance and influence on the problem. The cause with the highest probability is also determined.
Checking the most likely cause for correctness
On the basis of the knowledge and experience of specialists, it is finally analyzed whether the correct cause for the problem has actually been determined. Statistically, the assumption that the identified cause is a main cause can be supported with a significance test (hypothesis test).
example
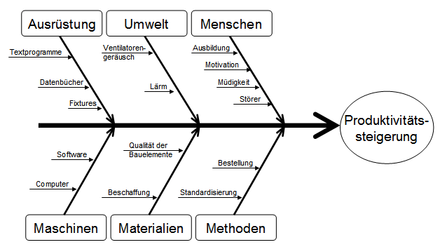
In the example shown here, the increase in productivity represents an effect to be achieved. In order to arrive at this result, all relevant influences must be correct. For this purpose, six of the main influencing variables of the 7-M method were selected (here equipment, environment (or also milieu or community), people, machines, materials, methods ) and at least one cause was sought for each and added to the effect arrow.
For the human cause category , with the aim of increasing productivity, the effective causes of training, motivation, tiredness and disruptors were then applied. In a further step, these could be examined in more detail, for example for their causes or also their type of effect on the effect to be achieved. Starting from this, approaches can be derived for solving problems or achieving goals. So you could prevent disruptions and disruptions, increase motivation or improve the training of employees in order to achieve an increase in productivity.
scope of application
- For the systematic and complete determination of the causes of problems
- Analysis and structuring of processes
- When the network of relationships of complex structures (cause-and-effect network) needs to be visualized and weighted
- Suitable for discussing any problem within a team ( brainstorming in a group or in a team)
rating
advantages
- Good basis for discussion in group work
- Teamwork enables a versatile approach
- Little effort in implementation
- Easy to learn and use
- Promotion of a better understanding of problems and their various causes
disadvantage
- Confusing and extensive for complex problems
- No networked cause-effect relationships can be represented
- Interactions and time dependencies are not recorded
literature
- Kent Bauer: KPI Identification With Fishbone Enlightenment. In: DM Review. Vol. 15, Issue 3, March 2005, ISSN 1521-2912 , p. 12.
- Ludger Brüning, Tobias Saum: Teaching successfully through visualization. Graphical structuring with strategies of cooperative learning. New German School, Essen 2007, ISBN 978-3-87964-308-0 .
- Johannes Kern: Ishikawa Diagrams - Cause and Effect Diagrams. Grin Verlag, Munich 2009, ISBN 978-3-640-28414-6 .
- Deborah Donndelinger, Barbara Van Dine: Use the cause-and-effect diagram to manage conflict. In: Quality Progress. Vol. 2, June 9, 1996, ISSN 0033-524X , p. 136.
- Frank Gregory: Cause, Effect, Efficiency and Soft Systems Models. In: The Journal of the Operational Research Society. Vol. 44, No. 4, April 1993, ISSN 0030-3623 , pp. 333-344.
- Michael Hermens: A new use for Ishikawa diagrams. In: Quality Progress. Vol. 30, June 1997. pp. 81-84.
- Götz Schmidt: Organization and Business Analysis - Methods and Techniques . 15th edition. Giessen 2015, ISBN 978-3-921313-93-0 .
- Manfred Schulte-Zurhausen : Organization. 3rd revised edition. Verlag Vahlen, Munich 2002, ISBN 3-8006-2825-2 .
- Josef W. Seifert : Visualization - Presentation - Facilitation: Translation of the German Classic Gabal Verlag, Offenbach 2012, ISBN 978-3-86936-394-3 .
Web links
- System analysis with cause-effect diagrams (PDF, 1.3 MB)
- QS-1-2-3-4 - Commercial software for the automatic generation of Ishikawa diagrams
Individual evidence
- ↑ Götz Schmidt: Organization and Business Analysis - Methods and Techniques , 15th edition, Gießen 2014, p. 312.
- ^ Schulte-Zurhausen, M. (2002): Organization. 3rd edition, Verlag Vahlen Munich 2002, p. 513.
- ^ Schulte-Zurhausen, M. (2002): Organization. 3rd edition, Verlag Vahlen Munich 2002, p. 514.

