East Sikkim
| East Sikkim District | |
|---|---|

|
|
| State | Sikkim |
| Administrative headquarters : | Gangtok |
| Area : | 954 km² |
| Residents : | 283,583 (2011) |
| Population density : | 297 inhabitants / km² |
The East Sikkim District is a district in the Indian state of Sikkim . The district administration is based in Gangtok .
geography
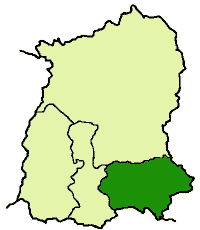
The East Sikkim District extends over the southeast of the state of Sikkim. The area is 954 km². The district is bordered by South Sikkim to the west, North Sikkim to the north, Tibet ( PR China ) to the northeast, Bhutan to the southeast and the Darjeeling district ( West Bengal state ) to the south . The area includes the mountainous region south of the High Himalayas and is bounded by the Tista river valley in the west. The Rangpo Chhu river valley lies in the southern district .
population
According to the 2011 census, the East Sikkim district has a population of 283,583. With 297 inhabitants per square kilometer, the district is densely populated. The district is predominantly rural. Of the 283,583 residents, 161,096 people (56.81%) live in rural areas and 122,487 people in urban communities.
The East Sikkim district is one of the areas of India that are heavily populated by members of the "tribal population" ( scheduled tribes ). Among them (2011) were 78,436 people (27.66 percent of the district population). In 2011, 15,305 people (5.40 percent of the district's population) belonged to the Dalit ( scheduled castes ).
Population development
As everywhere in India, the population in the East Sikkim district has been growing rapidly for decades. The increase in the years 2001-2011 was almost 16 percent (15.73%). In these ten years the population increased by over 38,000 people. The following table illustrates the development:

Significant places
In the district there are with the district capital Gangtok and Rangpo, two places with more than 10,000 inhabitants. Statistically, however, the two settlements of Rhenak and Singtam are also considered towns (notified towns).

District population by gender
As is common in India, the district always had more male than female residents. Even by Indian standards, the surplus of men was well above average. But in recent years the surplus of men has been falling again. Among the youngest residents (under 7 years of age) the proportions are 51.02% male to 48.98% female.
| Distribution of the population by gender in East Sikkim district | ||||||||||||||
| 1961 census | 1971 census | 1981 census | 1991 census | 2001 census | 2011 census | |||||||||
| number | proportion of | number | proportion of | number | proportion of | number | proportion of | number | proportion of | number | proportion of | |||
| TOTAL | 56,704 | 100% | 85,621 | 100% | 138,762 | 100% | 178,452 | 100% | 245.040 | 100% | 283,583 | 100% | ||
| Men | 30.091 | 53.07% | 47,817 | 55.85% | 77,232 | 55.66% | 95,986 | 53.79% | 132.917 | 54.24% | 151,432 | 53.40% | ||
| Women | 26,613 | 46.93% | 37,804 | 44.15% | 61,530 | 44.34% | 82,466 | 46.21% | 112.123 | 45.76% | 132.151 | 46.60% | ||
District population by language
The population of the East Sikkim district is linguistically mixed. However, a clear majority speaks Nepali. However, almost 83 percent of the population belong to the three strongest language groups, Nepali, Hindi and Bhotia. In the Gangtok sub-division, 137,291 people (62.56 percent of residents) speak Nepali, 21,934 people (9.99 percent of residents) speak Hindi, 18,910 people (8.62 percent of residents) speak Bhotia, 8,390 people (3.82 percent of residents) speak Bhotia Percent of residents) Lepcha, 5,490 people (2.50 percent of residents) Bhojpuri (Hindi language), 2,771 people (1.26 percent of residents) Tamang and 2,106 people (0.96 percent of residents) Limbu. In the Pakyong sub-division, 26,710 people (73.40 percent of residents) speak Nepali, 3,180 people (8.74 percent of residents) speak Bhotia, 1,331 people (3.66 percent of residents) speak Tamang, and 1,257 people (3.45 percent) of residents) Limbu and 896 people (2.46 percent of residents) Hindi. In the Rongli sub-division, 22,000 people (79.30 percent of residents) speak Nepali, 1,651 people (5.95 percent of residents) speak Hindi, 1,018 people (3.67 percent of residents) speak Bhotia, and 565 people (2.04 percent) of residents) Rai and 564 people (2.03 percent of residents) Bhojpuri. The most common languages are shown in the following table:
| year | Nepali | Hindi | Bhotia | Lepcha | Bhojpuri | Bengali | Tamang | Limbu | sherpa | Rai | Tibetan | Total | ||||||||||||
|---|---|---|---|---|---|---|---|---|---|---|---|---|---|---|---|---|---|---|---|---|---|---|---|---|
| number | % | number | % | number | % | number | % | number | % | number | % | number | % | number | % | number | % | number | % | number | % | number | % | |
| 2011 | 186.001 | 65.59 | 24,481 | 8.63 | 23,108 | 8.15 | 9,666 | 3.41 | 6,390 | 2.25 | 4,699 | 1.66 | 4.221 | 1.49 | 3,641 | 1.28 | 3,240 | 1.14 | 2,104 | 0.74 | 1,455 | 0.51 | 283,583 | 100.00% |
| Source: 2011 census result | ||||||||||||||||||||||||
Population of the district by confession
A clear majority of the residents are Hindus (Hindi, majority with the Limbu and Nepali). Buddhists (Bhotia, majorities among the Lepcha and Tamang) and Christians (minorities among the Bhotia, Lepcha, Limbu and Tamang) are significant religious minorities. The smaller religious minorities include Sikhs and Muslims. The following table shows the exact religious composition of the population:
| year | Buddhists | Christians | Hindus | Jainas | Muslims | Sikhs | Other | not specified | Total | |||||||||
|---|---|---|---|---|---|---|---|---|---|---|---|---|---|---|---|---|---|---|
| number | % | number | % | number | % | number | % | number | % | number | % | number | % | number | % | number | % | |
| 2011 | 72,455 | 25.55 | 23,398 | 8.25 | 177.910 | 62.74 | 214 | 0.08 | 6,198 | 2.19 | 861 | 0.30 | 1,726 | 0.61 | 821 | 0.29 | 283,583 | 100.00% |
| Source: 2011 census result | ||||||||||||||||||
education
Thanks to significant efforts, literacy has risen sharply in recent decades. In urban areas, almost 90 percent of the population can read and write. In the country, four out of five people can read and write. The strong differences between the sexes and the urban / rural population are typical of Indian conditions.
| Literacy in East Sikkim District | ||||||
| unit | 2011 census | |||||
| number | proportion of | |||||
| TOTAL | 214,329 | 83.85% | ||||
| Men | 121,345 | 88.47% | ||||
| Women | 92,984 | 78.50% | ||||
| TOTAL CITY | 98,438 | 88.90% | ||||
| City men | 53,844 | 92.50% | ||||
| City women | 44,594 | 84.91% | ||||
| TOTAL COUNTRY | 115.891 | 79.99% | ||||
| Country men | 67.501 | 85.50% | ||||
| Country women | 48,390 | 73.40% | ||||
| Source: 2011 census result | ||||||
Administrative division
The district was divided into three sub-divisions at the last census in 2011. Namely in Gangtok , Pakyong and Rongli .
| Population in the sub-divisions | ||||||||
| Gangtok | Pakyong | Rongli | ||||||
| number | proportion of | number | proportion of | number | proportion of | |||
| TOTAL | 219,450 | 100% | 36,392 | 100% | 27,741 | 100% | ||
| Men | 118.229 | 53.88% | 18,795 | 51.65% | 14,408 | 51.94% | ||
| Women | 101.221 | 46.12% | 17,597 | 48.35% | 13,333 | 48.06% | ||
| city | 116.604 | 53.13% | 0 | 0% | 5,883 | 21.21% | ||
| country | 102,846 | 46.87% | 36,392 | 100% | 21,858 | 88.79% | ||
Web links
Individual evidence
- ↑ statoids.com
- ^ East Sikkim District: Census 2011 data
- ↑ A - 2 DECADAL VARIATION IN POPULATION SINCE 1901
- ^ Result of the 2011 census on city population
- ^ District Census Handbook for all of Sikkim
Coordinates: 27 ° 19 ' N , 88 ° 36' E
