
West Sikkim
| West Sikkim District | |
|---|---|

|
|
| State | Sikkim |
| Administrative headquarters : | Gyalshing |
| Area : | 1166 km² |
| Residents : | 136,299 (2011) |
| Population density : | 117 inhabitants / km² |

The West Sikkim District is a district in the Indian state of Sikkim . The seat of the district administration is Gyalshing (sometimes also called Geyzing).
geography
The West Sikkim District extends over the southwest of the state of Sikkim. The area is 1166 km². The district borders on Nepal to the west, North Sikkim to the north, South Sikkim to the east and the Darjeeling district (state of West Bengal ) to the south . The area includes the mountainous region south of the High Himalayas . In the north, the ridge between Kabru and Pandim forms the border with the neighboring district of North Sikkim. The Rangit river valley runs along the eastern border of the district.
In the north of the district is the Kangchenjunga National Park .
population
According to the 2011 census, the West Sikkim district has 136,435 inhabitants. With 117 inhabitants per square kilometer, the district is densely populated. The district is predominantly rural. Of the 136,435 residents, 131,187 people (96.15%) live in rural areas and 5,248 people in urban communities.
The West Sikkim district is one of the areas of India that are heavily populated by members of the "tribal population" ( scheduled tribes ). They included (2011) 57,817 people (42.38 percent of the district population). In 2011, the Dalit ( scheduled castes ) numbered 5,935 people (4.35 percent of the district's population).
Population development
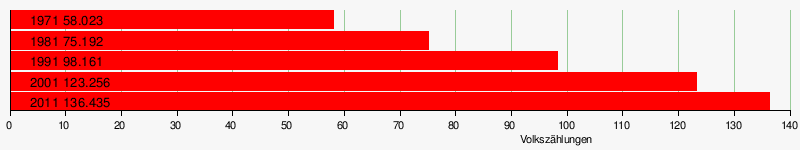
As everywhere in India, the population in the West Sikkim district has been growing rapidly for decades. The increase between 2001 and 2011 was almost 11 percent (10.69%). In these ten years the population increased by over 13,000 people. The following table illustrates the development:
Significant places
There are no places with more than 10,000 inhabitants in the district. From a statistical point of view, however, the two settlements Gyalshing and Nayabazar are also considered towns (notified towns).

District population by gender
As is common in India, the district always had more male than female residents. But in recent years the surplus of men has been falling again. Among the youngest residents (under 7 years of age) the proportions are 50.91% male to 49.09% female.
| Distribution of the population by gender in the West Sikkim district | ||||||||||||||
| 1971 census | 1981 census | 1991 census | 2001 census | 2011 census | ||||||||||
| number | proportion of | number | proportion of | number | proportion of | number | proportion of | number | proportion of | |||||
| TOTAL | 58.023 | 100% | 75.192 | 100% | 98.161 | 100% | 123.256 | 100% | 136,435 | 100% | ||||
| Men | 29,961 | 51.64% | 39,444 | 52.46% | 51,246 | 52.21% | 63,912 | 51.85% | 70,238 | 51.48% | ||||
| Women | 28,062 | 48.36% | 35,748 | 47.54% | 46,915 | 47.79% | 59,344 | 48.15% | 66,197 | 48.52% | ||||
District population by language
The West Sikkim District's population is linguistically mixed. A slim majority speaks Nepali. Over 76 percent of the population belong to the two strongest language groups, Nepali and Limbu. In the Gyalshing sub-division, 37,162 people (51.85 percent of residents) speak Nepali, 15,859 people (22.13 percent of residents) speak Limbu, 6,218 people (8.68 percent of residents) speak Lepcha, 5,056 people (7.05 percent) of residents) Bhotia, 1,926 people (2.69 percent of residents) Sherpa, 1,107 people (1.54 percent of residents) Rai and 1,063 people (1.48 percent of residents) Hindi. In the Soreng sub-division, 42,160 people (65.10 percent of residents) speak Nepali, 9,027 people (13.94 percent of residents) speak Limbu, 2,246 people (3.00 percent of residents) Sherpa, 2,193 people (2.93 percent) of residents) Tamang, 1,695 people (2.27 percent of residents) Bhotia and 1,156 people (1.55 percent of residents) Rai. The most common languages are shown in the following table:
| year | Nepali | Limbu | Lepcha | Bhotia | sherpa | Tamang | Rai | Hindi | Bhojpuri | Total | ||||||||||
|---|---|---|---|---|---|---|---|---|---|---|---|---|---|---|---|---|---|---|---|---|
| number | % | number | % | number | % | number | % | number | % | number | % | number | % | number | % | number | % | number | % | |
| 2011 | 79,322 | 58.14 | 24,886 | 18.24 | 9,490 | 6.96 | 6,751 | 4.95 | 4.172 | 3.06 | 2,782 | 2.03 | 2.263 | 1.66 | 2,001 | 1.47 | 992 | 0.73 | 136,435 | 100.00% |
| Source: 2011 census result | ||||||||||||||||||||
Population of the district by confession
A small majority of the residents are Hindus (Hindi, majority with the Limbu and Nepali). Buddhists (Bhotia, majorities among the Lepcha and Tamang), Christians (minorities among the Bhotia, Lepcha, Limbu and Tamang) and followers of traditional religions (predominantly Limbu; followers of the Yumasam religion) are significant religious minorities. The Muslims are a smaller religious minority. The following table shows the exact religious composition of the population:
| year | Buddhists | Christians | Hindus | Jainas | Muslims | Sikhs | Other | not specified | Total | |||||||||
|---|---|---|---|---|---|---|---|---|---|---|---|---|---|---|---|---|---|---|
| number | % | number | % | number | % | number | % | number | % | number | % | number | % | number | % | number | % | |
| 2011 | 36,390 | 26.67 | 13.002 | 9.53 | 75.286 | 55.18 | 20th | 0.01 | 965 | 0.71 | 40 | 0.03 | 10,477 | 7.68 | 255 | 0.19 | 136,435 | 100.00% |
| Source: 2011 census result | ||||||||||||||||||
education
Thanks to significant efforts, literacy has risen sharply in recent decades. In urban areas, almost 90 percent of the population can read and write. In the countryside, more than three out of four people can read and write. The strong differences between the sexes and the urban / rural population are typical of Indian conditions.
| Literacy in the West Sikkim district | ||||||
| unit | 2011 census | |||||
| number | proportion of | |||||
| TOTAL | 93,432 | 77.39% | ||||
| Men | 51,988 | 83.53% | ||||
| Women | 41,444 | 70.86% | ||||
| TOTAL CITY | 4,207 | 89.34% | ||||
| City men | 2,277 | 93.47% | ||||
| City women | 1,930 | 84.91% | ||||
| TOTAL COUNTRY | 89,225 | 76.90% | ||||
| Country men | 49,711 | 83.12% | ||||
| Country women | 39,514 | 70.29% | ||||
| Source: 2011 census result | ||||||
Administrative division
The district was split into two sub-divisions at the last 2011 census. Namely in Gyalshing and Soreng .
| Population in the sub-divisions | ||||||||
| Gyalshing | Soreng | |||||||
| number | proportion of | number | proportion of | |||||
| TOTAL | 71,675 | 100% | 64,760 | 100% | ||||
| Men | 37,177 | 51.87% | 33,061 | 51.05% | ||||
| Women | 34,498 | 48.13% | 31,699 | 48.95% | ||||
| city | 4.013 | 5.60% | 1,235 | 1.91% | ||||
| country | 67,662 | 94.40% | 63,525 | 98.09% | ||||
Web links
Individual evidence
- ↑ statoids.com
- ↑ West Sikkim District: Census 2011 data
- ↑ A - 2 DECADAL VARIATION IN POPULATION SINCE 1901
- ^ Result of the 2011 census on city population
- ^ District Census Handbook for all of Sikkim
Coordinates: 27 ° 17 ' N , 88 ° 15' E