
Distribution of income in the European Union
_(PPCS_per_inhabitant).png)
The income distribution of the European Union considers the personal distribution of income in the European Union . The personnel distribution is mostly measured by Eurostat on the basis of the equivalised disposable income . In addition, there are two different ways of looking at the income distribution in the EU: on the one hand, the income distributions of the individual member states can be compared and, on the other hand, the income distribution of the EU as a whole can be viewed, in the latter case both income differences in the individual countries and income differences between the countries in the Include consideration.
The European Union has formulated and partially implemented numerous measures , for example in the context of its cohesion policy or in the European Pillar of Social Rights of the European Commission , which either influence or directly affect the income distribution of the member states and the EU-wide income distribution. The differences in disposable income between the individual EU countries are significant, as Figure 1 and the following table show. For example, in 2017 the average income ranged from 3,059 euros in Romania to 41,562 euros in Luxembourg and the Gini coefficients from 23.2 in Slovakia to 40.2 in Bulgaria . The Gini coefficient of the EU-wide income distribution of equivalised disposable income was around 35 in 2013, while the weighted average of the Gini coefficients of the member states was only 30.5. This means that the income inequality of equivalised disposable income in the EU as a whole was lower in 2013 than in the US , where the Gini coefficient was around 37.5.
Income distributions of the member states
In the table, the EU countries are listed in ascending order according to their ISO 3166 code, at the end of the table the links to the article Income distribution in… .
| country | year | Gini index | Median income in EUR | Average income in EUR | S80 / S20 ratio | Left |
|---|---|---|---|---|---|---|
|
|
2017 | 30.7 | 16,909 | 19,387 | 5.1 | EU28 average |
|
|
2017 | 27.9 | 24,752 | 27,629 | 4.3 | Austria |
|
|
2017 | 26.0 | 22,784 | 24,408 | 3.8 | Belgium |
|
|
2017 | 40.2 | 3,590 | 4,598 | 8.2 | Bulgaria |
|
|
2017 | 30.8 | 14,497 | 17,218 | 4.6 | Cyprus |
|
|
2017 | 24.5 | 8,282 | 9,282 | 3.4 | Czech Republic |
|
|
2017 | 29.1 | 21,920 | 24,780 | 4.5 | Germany |
|
|
2017 | 27.6 | 29,383 | 32,792 | 4.1 | Denmark |
|
|
2017 | 31.6 | 9,384 | 10,698 | 5.4 | Estonia |
|
|
2017 | 33.4 | 7,600 | 8,800 | 6.1 | Greece |
|
|
2017 | 34.1 | 14,203 | 16,390 | 6.6 | Spain |
|
|
2017 | 25.3 | 23,987 | 26,689 | 3.5 | Finland |
|
|
2017 | 29.3 | 22,077 | 25,613 | 4.4 | France |
|
|
2017 | 29.9 | 6.210 | 6,851 | 5.0 | Croatia |
|
|
2017 | 28.1 | 4,988 | 5,589 | 4.3 | Hungary |
|
|
2017 | 30.6 | 22,879 | 27.009 | 4.6 | Ireland |
|
|
2017 | 32.7 | 16,542 | 18,714 | 5.9 | Italy |
|
|
2017 | 37.6 | 6.134 | 7,555 | 7.3 | Lithuania |
|
|
2017 | 30.9 | 36,076 | 41,562 | 5.0 | Luxembourg |
|
|
2017 | 34.5 | 6,607 | 7,831 | 6.3 | Latvia |
|
|
2017 | 28.3 | 14,496 | 16,365 | 4.2 | Malta |
|
|
2017 | 27.1 | 23,561 | 26,350 | 4.0 | Netherlands |
|
|
2017 | 29.2 | 5,945 | 6,810 | 4.6 | Poland |
|
|
2017 | 33.5 | 9,071 | 10,863 | 5.7 | Portugal |
|
|
2017 | 33.1 | 2,742 | 3,059 | 6.5 | Romania |
|
|
2017 | 28.0 | 25,376 | 27,890 | 4.3 | Sweden |
|
|
2017 | 23.7 | 12,713 | 13,585 | 3.4 | Slovenia |
|
|
2017 | 23.2 | 7,183 | 7,491 | 3.5 | Slovakia |
|
|
2017 | 33.1 | 20,995 | 25,243 | 5.4 | Great Britain |
Gini coefficient

The Gini coefficient is a distribution measure that summarizes the inequality of a distribution in a single number. A Gini index of 0 means, for example, for a personal income distribution that all people earn the same amount and thus complete income equality prevails, while a Gini index of 100 shows that a single person receives the entire income of a society, which means that there is a maximum income inequality would. In 2017, the weighted average of the Gini coefficients for the equivalised disposable income of the EU-28 countries was 30.7. However, as explained in more detail below, it should be noted that this weighted average probably underestimates the inequality of the EU-wide income distribution to a considerable extent, since income differences between the countries are not taken into account, which is a large one in the case of the EU-28 countries Play a role (see table above). There are also strong differences in income inequality in the individual EU member states. In 2017, the Gini coefficients of equivalised disposable income ranged from 23.2 in Slovakia to 40.2 in Bulgaria.

The Gini index is a relatively sluggish measure of income inequality, which is why even small changes in the Gini index mean significant changes in the underlying income distribution, and year-on-year changes are usually small. Nevertheless, by comparing the Gini coefficients for the years 2008 and 2017, a rough overview of the development of income inequality in the EU member states over the past decade can be obtained (Figure 2). This shows that while the weighted average of the EU-28 changed only slightly from 31 in 2008 to 30.7 in 2017, there were sometimes large changes in income inequality in the individual member states. In this context, however, no general trend can be ascertained, as developments in the individual countries differ greatly. For example, while Bulgaria, Denmark , Lithuania and Hungary saw their Gini coefficients rise sharply, they fell significantly in Latvia, Poland , Portugal and Romania.
A closer look also shows that income inequality in the individual EU member states has developed quite differently over time, while a simple look at the average values at EU level shows hardly any changes. Figure 3 therefore shows the development of the Gini coefficients for available equivalised income (with and without social transfers and pensions) of all EU member states and the respective weighted EU average over the period from 2005 to 2017. In addition to the yellow lines, the respective EU average of the Gini for the incomes before or after social transfers and pensions, the blue and green lines show the Gini values of the individual EU member states before and after social transfers and pensions.
At first glance, the considerable redistribution performance of the European welfare states becomes apparent, which through social transfers and pensions in the EU reduce the Gini for available equivalised income from around 50 to around 30. It can also be observed that the EU average values, which are calculated using the Ginis of the individual countries weighted according to their relative population size, essentially follow the developments in the most populous countries. The developments in Germany, France, Great Britain and Italy, which together make up around 50% of the EU population, have a major influence on the Gini coefficients, which are published by Eurostat for the EU, while the developments in smaller countries are less significant ( Germany , France , Great Britain, and Italy are highlighted in Figure 3 for this purpose).
Median and mean income
Both median and average income provide information about the income level of a society. The average income indicates the arithmetic mean of all incomes, while the median represents the income of the person who is exactly in the middle of the income distribution (50% earn more, 50% earn less). Since income distributions are usually skewed to the right , the average income is usually above the median income . This is because the average income takes a small number of high incomes into account more than the median income.
In 2017, the weighted mean of the national average of the equivalised disposable income of the EU-28 countries was 19,387 euros, while the median income was 16,909 euros. In this case, too, there are large differences between the member states behind the weighted average values at EU level. The median and average incomes in 2017 ranged from 2,742 euros or 3,059 euros in Romania to 36,076 euros or 41,562 euros in Luxembourg. A comparison of the income levels of the various countries reveals a considerable income inequality between the countries, the importance of which is discussed below in the context of the EU-wide income distribution.
S80 / S20 income quintile ratio

The S80 / S20 income quintile ratio is a further distribution measure in which the total income of the top 20% of the income distribution is related to the total income of the bottom 20%. The higher the ratio, the higher the inequality. The weighted average of the S80 / S20 ratios for the equivalised disposable income of the EU-28 countries was 5.1 in 2017. This would mean that the top 20% earned 5.1 times as much as the bottom 20%. In this case, too, it can be assumed that this value would be higher for the EU-wide income distribution, taking into account the income differences between the countries. In 2017 the S80 / S20 ratio ranged from 3.4 in Slovenia and the Czech Republic to 8.2 in Bulgaria. A comparison of the values from 2008 and 2017 shows a similar picture for the development of the S80 / S20 ratios as for the Gini coefficients.
EU-wide distribution of income
Although the EU is not a nation-state, there has been an increasing interest in the EU-wide distribution of income in recent decades. This can initially be explained by the fact that the EU shares essential characteristics from an economic point of view with nation states, which the EU as an economic area also grants, at the latest from the introduction of the European internal market with its four basic freedoms (free movement of goods , freedom of services , free movement of persons and free movement of capital and payments ) make a suitable subject for distribution research. In addition, the consideration of the income distribution in the EU, in contrast to the aggregation of the distribution measures of individual member countries, offers an appropriate comparison option with populous countries such as the USA. After all, the EU has been pursuing an active cohesion policy for decades ( e.g. as part of its regional policy ), which among other things pursues goals such as convergence, i.e. the catching up of economically less developed regions, and should therefore have direct, inequality-reducing effects on the distribution of income in the EU.
With the introduction of the European Community Statistics on Income and Living Conditions ( EU-SILC ) in 2003, the full coverage of the member states achieved only a few years later and the international comparability of the surveys also provided a suitable database for (approximate) determination of the EU wide income distribution created. As part of the EU-SILC, nationally representative household surveys are carried out annually on topics such as income, poverty and living conditions in the EU countries, whereby it is also ensured that the surveys are comparable between the countries. If all national surveys are taken together, statements about the entire EU population can also be made using EU-SILC. Since EU-SILC data are collected by means of personal surveys , however, there are also difficulties associated with this collection method. For example, it is likely that particularly high incomes are not sufficiently recorded in the EU-SILC and that income inequality is thus underestimated. Nevertheless, numerous recent studies on the EU-wide distribution of income use EU-SILC data.
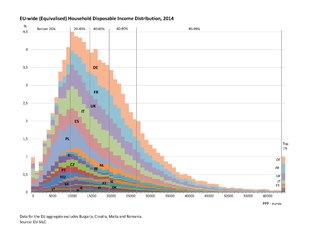
The EU-wide distribution of income is primarily influenced by two factors: on the one hand, income inequality in the individual countries and, on the other hand, income inequality between countries. The table above provides initial clues to both factors, because both the income distributions and the average income levels of the member states show strong differences. However, since there are also significantly different price levels in the countries, the mere comparison of average incomes distorts the differences in purchasing power between the individual countries considerably. But even if the income data are adjusted for purchasing power parities, large income differences between the member states remain. So it happens that people in Eastern European countries are particularly in the lowest income quintile when considering the EU-wide income distribution , while in the upper quintile almost exclusively people from the original EU15 countries are represented. This is also illustrated by Figure 5, which shows the EU-wide income distribution for equivalised disposable income in 2014 (but excluding Bulgaria, Croatia, Malta and Romania) and also highlights where people from the individual member states find themselves in the overall distribution. The income (in PPP -Euros) is plotted on the x-axis and the proportions of the EU population per 1000-euro interval are plotted on the y-axis, with all incomes above or below that being combined for the top and bottom percentiles. The graph thus illustrates how income inequality in the EU depends both on income inequality within countries and on income inequality between countries.
If one compares the Gini coefficient for the EU-wide distribution of income with those of the individual member states, it is roughly in the vicinity of the member states with the highest inequality, but about 30% above the member states with the lowest inequality. If the Gini coefficient is calculated on the basis of the EU-wide income distribution for equivalised disposable income, it is around 35 in 2013. For a different income definition (disposable household income), this value is put at 33.6 by another study. In contrast, the value given by Eurostat in the country average as the Gini coefficient of equivalised disposable income for 2013 is only 30.5. The higher value for the EU-wide income distribution comes from the fact that in this case the income differences between the EU countries are also taken into account. A comparison with the USA shows that even using the EU-wide income distribution, the EU shows lower inequality (the Gini coefficient of equivalised disposable income for the USA in 2013 was around 37.5).
With regard to the development of the EU-wide distribution of income, two studies using different concepts for disposable household income come to the conclusion that EU-wide income inequality (as measured by the Gini index ) fell up to the crisis year 2008 and then either increased or remained the same . The decrease in inequality up to the crisis is due to the convergence of incomes, which is mainly due to the catching-up process in Eastern European countries, while the subsequent increase is due to an interruption in the convergence process and an increase in inequality in the individual countries. This development is also in line with the fact that the share of EU-wide income inequality, which can be explained by differences in average incomes between countries, declined over the period 2006-2013, while the importance of inequality in individual countries increased.
bibliography
- AB Atkinson: Income distribution in Europe and the United States. In: Oxford Review of Economic Policy. Volume 12, No. 1, 1996, pp. 15-28.
- M. Beblo, T. Knaus: Measuring income inequality in Euroland. In: Review of Income and Wealth. Volume 47, No. 3, 2001, pp. 301-333.
- A. Brandolini: Measurement of income distribution in supranational entities: The case of the European Union. (= Bank of Italy Temi di Discussione Working Paper. 623). Oxford University Press, 2007, ISBN 978-0-19-921812-7 .
- S. Filauro, Z. Parolin: Unequal unions? A comparative decomposition of income inequality in the European Union and United States. In: Journal of European Social Policy. Volume 29, No. 4, October 2019, pp. 545-563.
Web links
- Eurostat: European Pillar of Social Rights - indicators
- European Commission: EU regional policy
Remarks
- ↑ The Eurostat data relate to available equivalised income which is calculated from EU-SILC data.
- ↑ a b c The indicators at EU level give a weighted average of the indicators of the member states. See also the following manual "Algorithms to compute Overarching Indicators based on EU-SILC and adopted under the Open Method of Coordination (OMC)" under #Einzelnachweise .
- ↑ Since the income data that are queried in the SILC surveys generally refer to the income of the previous year, the distribution measures that are calculated and discussed in SILC studies mostly also relate (more or less explicitly) to the income distribution of the previous year.
Individual evidence
- ↑ a b c d e f Stefano Filauro: The EU-wide income distribution: inequality levels and decompositions . Ed .: European Commission. 2018.
- ↑ Miriam Beblo, Thomas Knaus: Measuring Income Inequality in Euroland . In: Review of Income and Wealth . tape 47 , no. 3 , 2001, ISSN 1475-4991 , p. 301–333 , doi : 10.1111 / 1475-4991.00019 ( wiley.com [accessed January 27, 2019]).
- ^ A b A. Atkinson: Income distribution in Europe and the United States . In: Oxford Review of Economic Policy . tape 12 , no. 1 , March 1, 1996, ISSN 1460-2121 , pp. 15-28 , doi : 10.1093 / oxrep / 12.1.15 .
- ↑ a b c d e f g h Publications Office of the European Union: Income inequalities and employment patterns in Europe before and after the great recession. April 4, 2017, accessed April 6, 2019 .
- ↑ a b c d Stefano Filauro, Zachary Parolin: Unequal unions? A comparative decomposition of income inequality in the European Union and United States . In: Journal of European Social Policy . November 12, 2018, ISSN 0958-9287 , doi : 10.1177 / 0958928718807332 .
- ↑ a b c d e f Eurostat: Gini coefficient of equivalised disposable income Source: SILC. Retrieved January 19, 2019 .
- ↑ a b Eurostat: Average and median income by household type - EU-SILC survey. Retrieved January 18, 2019 .
- ↑ a b Eurostat: S80 / S20 income quintile ratio by gender and by age group - EU-SILC survey. Retrieved January 19, 2019 .
- ↑ Eurostat: Algorithms to compute Overarching Indicators based on EU-SILC and adopted under the Open Method of Coordination (OMC). Eurostat, January 18, 2019, accessed on January 19, 2019 .
- ↑ Eurostat: Gini coefficient of equivalised disposable income before social benefits (pensions included in social benefits). Retrieved April 26, 2019 .
- ↑ Eurostat Glossary: Income quintile share. Eurostat, accessed on January 26, 2019 .
- ↑ Kristina Krell, Joachim R. Frick, Markus M. Grabka: Measuring the Consistency of Cross-Sectional and Longitudinal Income Information in EU-SILC . In: Review of Income and Wealth . tape 63 , no. 1 , May 14, 2015, ISSN 0034-6586 , p. 30-52 , doi : 10.1111 / roiw.12202 .
- ↑ Vladimir Hlasny, Paolo Verme: Top Incomes and Inequality Measurement: A Comparative Analysis of Correction Methods Using the EU SILC Data . In: Econometrics . tape 6 , no. 2 , June 4, 2018, ISSN 2225-1146 , p. 30 , doi : 10.3390 / econometrics6020030 ( mdpi.com [accessed April 13, 2019]).
- ^ A b Vacas-Soriano, Carlos Fernández-Macías, Enrique: Income Inequality in the Great Recession from an EU-wide Perspective . Munich: ifo Institute - Leibniz Institute for Economic Research at the University of Munich, 2018 ( worldcat.org [accessed on May 4, 2019]).