Distribution of income in Croatia
The income distribution in Croatia considers the distribution of income in Croatia and their development. The personal income distribution shows how the income of an economy is distributed among individual persons or population groups (e.g. women, men). It is measured by Eurostat on the basis of equivalised disposable income .
From 2010 to 2017, income inequality in Croatia decreased. The Gini index for Croatia fell from 31.6 to 29.9 points. In an EU comparison, Croatia is in 14th place (slightly below the EU average). The ratio of the income of the highest income 20 percent to the income of the lowest income 20 percent is 5. Accordingly, Croats in the highest income quintile earn 5 times as much as Croats in the lowest income quintile. The poverty rate in Croatia has decreased continuously since 2011 from 32.6% in 2011 to 26.4% in 2017.
overview
The following table gives an overview of distribution indicators based on the equivalised disposable income in Croatia between 2010 and 2017.
| indicator | 2010 | 2011 | 2012 | 2013 | 2014 | 2015 | 2016 | 2017 |
|---|---|---|---|---|---|---|---|---|
| Gini coefficient | 0.316 | 0.312 | 0.390 | 0.390 | 0.302 | 0.304 | 0.298 | 0.299 |
| S80 / S20 income ratio | 5.5 | 5.6 | 5.4 | 5.3 | 5.1 | 5.2 | 5.0 | 5.0 |
| of poverty or social exclusion
threatened persons (in%) |
31.1 | 32.6 | 32.6 | 29.9 | 29.3 | 29.1 | 27.9 | 26.4 |
| At-risk-of-poverty rate (in%) | 19.6 | 21.1 | 23.3 | 21.8 | 21.1 | 20.9 | 20.4 | 21.4 |
If one looks at the development of the poverty indicators, an opposite development can be observed. The proportion of people at risk of social exclusion or poverty fell from 31.1% of the population in 2010 to 26.4% in 2017. However, the at- risk-of-poverty rate rose from 19.6% to 21.4% over the same period. In 2015, income was distributed among the population as follows:
| Indicator (2015) | % |
|---|---|
| Income share of the first quintile | 7.3% |
| Income share of the second quintile | 13.1% |
| Third quintile share of income | 17.9% |
| Income share of the fourth quintile | 23.5% |
| Income share of the fifth quintile | 38.1% |
| Proportion of poverty ($ 5.5 / day level in PPP) | 5.8% |
| Proportion of poverty ($ 2 / day level in PPP) | 2.24% |
| Relative poverty gap ($ 2 / day level in PPP) | 0.86% |
| Relative poverty gap ($ 1.25 / day level in PPP) | 0.40% |
The lowest income quintile earned 7.3% of Croatia's disposable income in 2015, while the top quintile received 38.1% of income. The poverty rate, measured as people with an income equivalent to less than $ 2 per day, was 2.24% and 5.80% at $ 5.5 per day (measured in purchasing power parity (PPP)) in the same year .
Definitions of Income
The type and aggregation of income play a decisive role in the interpretation and comparability of the indicators. There are basically two types of income. The primary income (or market income) describes the income that is earned in the market (e.g. through dependent and self-employed work). If you subtract the taxes to be paid from this income and add state transfers received, you get the secondary income .
The primary income (or market income ) includes income from self-employment and Paid Employment and business activities, income from rents and capital before deduction of taxes and fees. Accordingly, the primary income distribution relates to the distribution of this market income. The secondary distribution of income relates to secondary income. This is the disposable income that a person has after the state has redistributed income. This redistribution includes the deduction of taxes and the granting of transfer payments such as pensions, sickness benefits or unemployment benefits.
As a rule, secondary income is compared between countries. The comparison between market income and disposable income provides information about the extent of the distributional policy measures in the country. The equivalised income is also used for international comparisons . For this, all sources of income are added after taking into account taxes and duties of a household and divided by the (adult) members of the household.
Income distribution in general
Median and average income
The average income is would get a country the income that each resident if the total income would be divided in equal parts. The median income is the income of the individual who is exactly in the middle of the income distribution. This means that the poorer half of a country has less than the median income and the richer half has more. In principle, the average income is always higher than the median income, since top incomes increase the average income, but the median income does not.
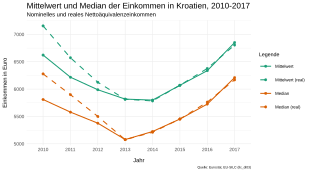
In 2017, the average nominal equivalent income in Croatia was € 6,851. The average for the European Union was more than three times that (€ 19,387). The median income in Croatia in 2017 was € 6,210, in the European Union an average of € 16,909. In recent years, both sizes have been U-shaped. In the years after the financial crisis, the average income and the median income fell both in nominal and real terms. They only rose again in 2013 and in 2017 the 2010 level was exceeded. One reason for this is the aftermath of the global economic crisis . Croatia was unable to recover from the global economic crisis for a long time, the economy experienced a six-year economic downturn, from 2009 and 2014 GDP fell by almost 13%. The adjustment of real and nominal income in the graph is striking: On the one hand, this is due to the construction of the inflation adjustment, in which nominal and real income are equated in 2015. Nevertheless, the similar trend in increasing incomes is remarkable.
Share of the top 10% of total income
The relative shares of income groups in total income offer another perspective on income distribution. The income of an income group (e.g. the richest ten percent) is added up and compared with the total income. If the income of a society were distributed completely evenly, the richest ten percent of the population would also earn ten percent of the income. In the EU, the ten percent with the highest income received an average of 23.9% of total income in 2017. In Croatia this figure was 22.2%, more than one and a half percentage points lower. With the exception of 2015, the income share of the richest ten percent in Croatia has decreased by more than one percentage point in the past eight years.
The graph on the right shows the trend in the share of income in Croatia and the neighboring countries ( Hungary , Serbia and Slovenia ). A comparison of the income share of the top 10 percent in Croatia with the neighboring countries and the EU average shows that Croatia is very close to the EU average. The highest inequality occurs in Serbia, the lowest in Slovenia. Hungary has seen inequality rise in recent years.
Gini index
The Gini index (or Gini coefficient) is the most common indicator of inequality. On a scale from 0 to 100 (or 0 to 1 for the Gini coefficient), it describes the extent of inequality in a population. A Gini index of 0 means equal income - all residents have the same income. A Gini index of 100 indicates total income inequality, one person owns the entire income of a country. Basically, countries with a Gini index between 50 and 70 are described as relatively unequal. If the index is between 20 and 35, they are considered to be of relatively equal income.
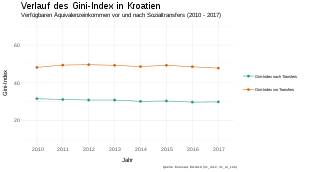
Looking at market income, the income before the state redistributed it through taxes and social transfers, Croatia had a Gini index of 47.8 in 2017. The inequality was slightly higher on the EU average, the Gini index was 51 points. Disposable income inequality after social transfers and taxes is significantly lower, the Gini index was 29.9 in Croatia and 30.7 in the EU. The Gini index in Croatia has remained relatively constant since 2010.
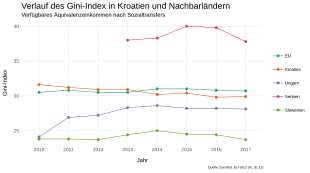
The graphs opposite compare the Gini index for Croatia with the indices of neighboring countries ( Hungary , Serbia and Slovenia ) as well as the EU average. The upper graph shows the development of the Gini indices of market income. The highest income inequality is found in Serbia. Hungary has adjusted to the EU average in recent years, Croatia is clearly below. Of these countries, Slovenia is the country with the lowest inequality in market income. Over the past two years, the Gini index fell in all countries except Serbia, which saw the index rise rapidly. If one compares the upper with the lower graph, it becomes clear that even after the income redistribution by the state Serbia shows the highest and Slovenia the lowest inequality with a similar time course. It is astonishing that the redistribution is relatively strong in Hungary; the Gini index for secondary incomes is well below the EU average - even if it has risen sharply in recent years. Croatia has been below the EU average since 2014, before it was just above it.
Historical development and estimate of the Gini coefficient
In the former Yugoslavia, a household consumption survey was carried out every five years, which could be used to analyze inequality at the level of the republic including Croatia. These were collected in 1973, 1978, 1983 and 1988. When a new survey was commissioned for Croatia in 1998, there were no reliable data on the basis of which the distribution of individual incomes could be assessed. From 1998 onwards an attempt was made to collect data on inequality and poverty in Croatia as part of a household survey by the World Bank. However, due to the war in Yugoslavia , these did not include the entire Croatian population and were therefore not representative, as the areas more severely affected by the war were underrepresented and, as a result, the inequality was greatly underestimated.
| Survey year | Gini coefficient |
|---|---|
| 1973 | 0.300 |
| 1978 | 0.294 |
| 1983 | 0.271 |
| 1988 | 0.286 |
| 1998 | 0.297 |
World Bank estimates of inequality in other transition countries in the late 1980s show the approximate magnitude of the Gini coefficient of 0.19 for almost all Eastern European countries with the exception of Poland with a Gini coefficient of 0.24 and Russia with 0.26. The database by Deininger and Squire (1996) provides similar data with an estimated Gini coefficient for Poland in the late 1980s of 0.254 and for the Soviet Union of 0.278. The estimates of the Gini coefficient for Croatia in 1988 of 0.29 reported by Nestic appear plausible in comparison with other countries in the region. This was explained at the time due to the more marketable elements of the Croatian economy and greater liberalization towards the other socialist economies.
Development since the transition
After the collapse of the Soviet Union and during the war in Yugoslavia in the early 1990s, the former Eastern Bloc countries went through a transition from (partly centrally planned) socialist economies to market economies. This liberalization process has resulted in an increase in income inequality. The average development of the Gini coefficient of the transition economies shows an increase from 0.26 (1989) to approximately 0.35 at the end of the 1990s. Income inequality in the successor states of the USSR and the Commonwealth of Independent States started from roughly the same starting level in 1989, but rose much more rapidly and peaked in 1996 with a Gini coefficient of 0.43. In contrast, income inequality in Croatia was relatively stable between levels of 0.28 and 0.30. These inequality values are slightly higher than in the CEEC-5 , but below those of the EU-25 or the average of the transition countries.
In the mid-1990s, there were institutional upheavals on the labor market in Croatia. The first national collective agreement was signed in 1992 and a new labor law was introduced in 1995. In 2003 the state lost its monopoly in job placement and further liberalization measures were introduced. The wage share and income inequality in Croatia show a negative relationship. The higher the share of wage income in GDP, the lower the Gini coefficient. From this it can be concluded that the above-average wage share has contributed to the relatively stable development of income inequality. There is also a negative correlation between the density of collective agreements and the Gini coefficient in transition countries (including Croatia). A similar negative correlation can be found between union density and income inequality in the former socialist countries.
In addition to the tax and labor market policy, the level and quality of education of the population is a decisive reason for the inequality in Croatia. The educational system in Croatia is given poor grades due to the below-average qualifications at all levels.
Income distribution by sex
S80 / S20 income quintile ratio
Like the Gini coefficient , the quintile ratio S80 / S20 is also a measure used to describe the unequal distribution of income. It describes the ratio between the total income of the 20% with the highest incomes (top quintile) and the total income of the 20% with the lowest incomes (bottom quintile). The further this value is from 1, the more unequal the income distribution between these two groups is. Income is understood to be the equivalised disposable income . The development of the income quintile ratio between men and women in Croatia is similar except for one outlier in 2013 and has converged over the last two years. However, the trend up to the EU accession year 2013 is contrary to the development in the EU average. While inequality in the EU countries, measured in terms of the income quintile ratio, has increased overall since 2010, it has decreased in Croatia. Since Croatia joined the EU on July 1, 2013, the development of the quintile income ratios in Croatia and in the EU average has been relatively uniform. The income quintile ratio for men in Croatia was last at 5 in 2017 (EU average: 5.1) and for women at 5.0 (EU average: 5.1). This means that the income quinti ratios are identical for both sexes.
Unadjusted gender pay gap
The unadjusted gender pay gap shows the difference between the average gross hourly wage of women and men as a percentage of the average gross hourly wage of male employees. The gender pay gap is calculated using the following data:
- the four-year Structure of Earnings Survey (SES) 2002, 2006, 2010 and 2014 to the extent required by the SES Regulation;
- National estimates based on national sources for the years between the SES years from the reference year 2007 with the same coverage as the SES.
The data are broken down into economic sectors (Statistical Classification of Economic Activities in the European Community - NACE ), economic control of the company (public / private) and working hours (full-time / part-time) and age (six age groups).
The gender wage gap is calculated to examine the wage gap between men and women . The graphic shows the development of the unadjusted gender wage gap in the NACE2 sectors of industry, construction and services (excluding public administration, defense and social insurance) in Croatia compared to the EU-27 member states. In 2010, the gender pay gap in industry, construction and services in Croatia was 5%. Unfortunately, very little data are available, but the wage gap has increased to 11%. On the basis of the inadequate data situation, one could speak of a doubling of the income gap between men and women between 2010 and 2017. For comparison: the European average gender wage gap was 17.3% in 2008 and only decreased by one percentage point to 16% in 2017.
Distribution of income by region
The unequal distribution of income in Croatia is not only visible in a gender comparison, but also in a spatial comparison. If one compares the continental Croatia with the Adriatic Croatia one can see an inequality between the regions both in the cultural and social area as well as in relation to economic aspects.
Disposable household income
The tourism in Croatia is one of the most important economic sectors and is annually about one-fifth of the gross domestic product . This is also reflected in the higher incomes of the inhabitants of the tourist coastal regions compared to the inhabitants of continental Croatia. While the disposable income per inhabitant in the coastal regions averaged 9,900 euros in 2016, the continental region had an average disposable income per inhabitant of 9,700 euros. Similar to other European countries, Croatia has a progressive tax system . As a result, redistributive effects based on progressive income tax and social transfer payments were already applied in the data used . A look at the development over time shows that Adriatic Croatia has only recently turned into a higher-income region and even had a significantly lower disposable income per capita than continental Croatia in the years after the euro crisis . Unfortunately, no statement can be made about the distribution of income within the individual regions (e.g. Zagreb and the 20 rural counties ), as the necessary microdata for calculating the key figure are not published.
Poverty and social exclusion
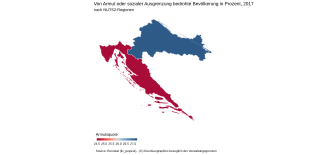
According to the Eurostat definition, a person is at risk of poverty and social exclusion if they are at risk of poverty , suffer from material deprivation or live in households with very low employment . A person with an equivalised income below 60% of the national median equivalised income is considered to be at risk of poverty. Material deprivation is defined as the involuntary inability to afford certain goods of daily life and includes on the one hand the economic burden and on the other hand the lack of durable consumer goods. The proportion of the population at risk of poverty in Croatia in 2017 was between 24.5% in continental Croatia and 27.3% in Adriatic Croatia. Viewed over time, the poverty rate in Croatia has decreased continuously since 2011 from 32.6% in 2011 to 26.4% in 2017, although the spatial differences have remained the same over time.
bibliography
- R. Crkvenčić: Analiza Ekonomske Nejednakosti u Hrvatskoj. Diplomski Rad, No. 200 / PE /, 2002. Sveučilište Sjever Sveučilišni Centar Varaždin.
- Klaus Deininger and Lyn Squire: A New Data Set Measuring Income Inequality. In: The World Bank Economic Review. Volume 10, No. 3, 1996, pp. 565-591.
- I. Grgurev and I. Vukorepa: Flexible and New Forms of Employment in Croatia and their Pension Entitlement Aspects. In: Transnational, European, and National Labor Relations. Springer, Cham, 2018, pp. 241–262.
- SD Hoffman, I. Bićanić and O. Vukoja: Wage inequality and the labor market impact of economic transformation: Croatia, 1970–2008. In: Economic Systems. Volume 36, No. 2, 2012, pp. 206-217.
- M. Holzner and S. Leitner: Inequality in Croatia in Comparison (No. 355). The Vienna Institute for International Economic Studies, wiiw, 2009.
- D. Nestić: Ekonomske nejednakosti u Hrvatskoj 1973–1998. In: Financijskateorija i praksa. Volume 26, No. 3, 2002, pp. 595-613
- D. Nestić: Ekonomska nejednakost u Hrvatskoj 1998. manja od očekivanja. In: Ekonomski pregled. Volume 53, 11-12, 2002, pp 1109-1150
- A. Poprzenovic: Remittances and Income Inequality in Croatia. 2007
- N. Karaman Aksentijević, N. Denona Bogović and Z. Ježić: Education, poverty and income inequality in the Republic of Croatia. In: Zbornik radova Ekonomskog fakulteta u Rijeci: časopis za ekonomsku teoriju i praksu. Volume 24, No. 1, 2006, pp. 19-37.
Individual evidence
- ↑ Eurostat: S80 / S20 income quintile ratio by gender. Retrieved January 19, 2019 .
- ↑ Eurostat: At- risk-of-poverty rate by social benefits by detailed age group - EU-SILC survey. Retrieved January 19, 2019 .
- ↑ Eurostat - Tables, Graphs and Maps Interface (TGM) table. Retrieved January 19, 2019 .
- ↑ Eurostat - Tables, Graphs and Maps Interface (TGM) table. Retrieved January 19, 2019 .
- ↑ Eurostat: S80 / S20 income quintile ratio by gender. Retrieved January 19, 2019 .
- ↑ Eurostat - Tables, Graphs and Maps Interface (TGM) table. Retrieved January 19, 2019 .
- ↑ Eurostat: At- risk-of-poverty rate by social benefits by detailed age group - EU-SILC survey. Retrieved January 19, 2019 .
- ↑ Croatia Income Share Held By Highest 10percent. Retrieved January 19, 2019 .
- ↑ Glossary: Equivalent Disposable Income - Statistics Explained. Retrieved May 9, 2019 .
- ^ Mean and median income by age and sex - EU-SILC survey - Eurostat. Retrieved May 12, 2019 .
- ^ Mean and median income by age and sex - EU-SILC survey - Eurostat. Retrieved May 12, 2019 .
- ^ Mean and median income by age and sex - EU-SILC survey - Eurostat. Retrieved May 7, 2019 .
- ↑ Economic prospects for Croatia (publication) . ( wiiw.ac.at [accessed on May 12, 2019]).
- ↑ Distribution of income by quantiles - EU-SILC survey - Eurostat. Retrieved May 8, 2019 .
- ^ Gini coefficient. October 19, 2010, accessed May 7, 2019 .
- ↑ Gini coefficient of equivalised disposable income - EU-SILC survey - Eurostat. Retrieved May 7, 2019 .
- ↑ Gini coefficient of equivalised disposable income before social transfers (pensions included in social transfers) - Eurostat. Retrieved May 7, 2019 .
- ↑ a b c D. Nestić: Ekonomske nejednakosti u Hrvatskoj 1973-1998. In: Financijskateorija i praksa . tape 26 , no. 3 , 2002, p. 595-613 .
- ↑ D. Nestić: Ekonomska nejednakost u Hrvatskoj 1998. manja od očekivanja, Ekonomski pregled . tape 53 , no. 11-12 , 2002, pp. 1109-1150 .
- ↑ R. Crkvenčić: Analiza ekonomske nejednakosti u Hrvatskoj (... Doctoral dissertation, University North University center Varaždin Department of Business Economics). 2018.
- ^ Margaret [editor] * Glewwe Grosh: Volume Two . No. 20731 . The World Bank, May 31, 2000, pp. 1 ( worldbank.org [accessed January 19, 2019]).
- ^ Klaus Deininger and Lyn Squire: A New Data Set Measuring Income Inequality . In: The World Bank Economic Review . tape 10 , no. 3 , 1996, p. 565-591 .
- ↑ a b c d M. Holzner and S. Leitner: Inequality in Croatia in Comparison . In: The Vienna Institute for International Economic Studies .
- ^ Saul D. Hoffman, Ivo Bićanić, Oriana Vukoja: Wage inequality and the labor market impact of economic transformation: Croatia, 1970–2008 . In: Economic Systems . tape 36 , no. 2 , June 2012, ISSN 0939-3625 , p. 206-217 , doi : 10.1016 / j.ecosys.2011.08.002 .
- ↑ N. Karaman Aksentijević, N. Denona Bogović and Z. Ježić: Education, poverty and income inequality in the Republic of Croatia. Zbornik radova Ekonomskog fakulteta u Rijeci: časopis za ekonomsku teoriju i praksu . tape 24 , no. 1 , p. 19-37 .
- ↑ S80 / S20 income quintile share ratio by sex and selected age group - EU-SILC survey - Eurostat. Retrieved May 14, 2019 .
- ↑ Gender pay gap in unadjusted form by NACE Rev. 2 activity - structure of earnings survey methodology - Eurostat. Retrieved May 14, 2019 .
- ↑ Bojan Huzanic: Investing in Croatia. (PDF) TPA Steuerberatung GmbH, accessed on May 8, 2019 (English).
- ↑ Glossary: Rate of people at risk of poverty or social exclusion (AROPE) - Statistics Explained. Retrieved May 8, 2019 .
- ↑ Glossary: At-risk-of-poverty rate - Statistics Explained. Retrieved May 8, 2019 .
- ↑ Glossary: At-risk-of-poverty rate - Statistics Explained. Retrieved May 8, 2019 .


