Population development of Mönchengladbach
This article shows the population development of Mönchengladbach in tabular and graphical form.
On December 31, 2007, the “ official population ” for Mönchengladbach was 260,018 according to updates by the State Office for Data Processing and Statistics North Rhine-Westphalia (only main residences and after comparison with the other state offices ).
Population development
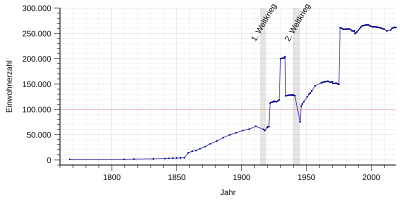
In the Middle Ages and the early modern period , Gladbach only had a few hundred inhabitants. The population increased only slowly and kept falling due to wars, epidemics and famine. Only with the beginning of industrialization in the middle of the 19th century did population growth accelerate. In 1857 the town of Oberniedergeburth and part of Obergeburth were incorporated into Gladbach. In 1855 only 3,142 people lived in the city, in 1890 there were already 50,000.
Until the end of the 19th century the place was called "Gladbach" or earlier Gleidebach (numerous other spellings have been handed down). When the city became a district on January 1, 1888, it was given the name Munich-Gladbach to better distinguish it from Bergisch Gladbach .
On August 1, 1921, the city of Munich-Gladbach (64,031 inhabitants 1919), the rural communities Munich-Gladbach (22,614 inhabitants 1919) and Neuwerk (11,836 inhabitants 1919) and the city of Rheindalen (8308 inhabitants 1919) joined together to form the new city of Munich-Gladbach with about 112,000 inhabitants together. On August 1, 1929, the incorporation of Rheydt (45,095 inhabitants in 1925), Odenkirchen (20,023 inhabitants in 1925) and other places increased the population of the new urban district of Gladbach-Rheydt to around 200,000. At the beginning of National Socialism, the city was again divided into two cities on August 1, 1933: "Munich-Gladbach" (with Hardt) and "Rheydt" (with Odenkirchen, Giesenkirchen and Schelsen).
In the census of May 17, 1939, 128,418 people were identified. During the Second World War , 60 percent of the city center was destroyed by Allied air raids. When the American army occupied Munich-Gladbach on March 1, 1945, 75,000 people were still living in the city. Due to the return of the evacuated persons and the influx of refugees and displaced persons from the German eastern areas , the population rose rapidly after the end of the war. As early as 1951, as many people were living in the city as before the war. On October 11, 1960, the name was changed to Mönchengladbach . In 1968 the population of the city of Rheydt exceeded the limit of 100,000, making it a major city again.
The incorporation of Rheydt (99,963 inhabitants) and Wickrath (13,961 inhabitants) on January 1, 1975 brought an increase of 114,000 people to a total of 263,000 inhabitants. In 1996 the city's population reached its all-time high of 266,873. In 2006 the city with 260,951 inhabitants was 26th among the major German cities and twelfth in North Rhine-Westphalia.
The following overview shows the number of inhabitants according to the respective territorial status. Up to 1809 it is an estimate, then census results or official updates by the city administration (until 1970) and the State Statistical Office (from 1971). From 1840 the information relates to the “customs clearance population”, from 1871 to the “local population”, from 1925 to the resident population and since 1987 to the “population at the place of the main residence”. Before 1840, the number of inhabitants was determined according to inconsistent survey methods.
From 1767 to 1870
(respective territorial status )
|
|
From 1871 to 1944
(respective territorial status)
|
|
|
Source: City of Mönchengladbach
From 1945 to 1989
(respective territorial status)
|
|
|
Sources: City of Mönchengladbach (until 1970), State Office for Data Processing and Statistics North Rhine-Westphalia (from 1971)
Since 1990
(respective territorial status)
A graphic representation of the data from 1990 can be found in the #Population forecast section
|
|
|
Source: State Office for Data Processing and Statistics North Rhine-Westphalia
Population forecast
In their 2006 “Guide to Demographic Change 2020”, in which the Bertelsmann Foundation provides data on the development of the population of 2959 municipalities in Germany, Mönchengladbach's population is predicted to decline by 3.4 percent between 2003 and 2020 (8,849 people) .
Absolute population development 2012–2030 - forecast for Mönchengladbach (main residences):
|
Source: Bertelsmann Foundation
In March 2016, Deutsche Postbank AG published a study conducted by Michael Bräuninger, professor at Helmut Schmidt University , entitled Housing Atlas 2016 - Living in the City , in which a population forecast for 36 major German cities for the year 2030 is carried out. It also explicitly takes into account the immigration in the context of the refugee crisis in Germany from 2015 . For Mönchengladbach, it predicts a population decline of 3.98% from 2015 to 2030 despite the influx of refugees.
Population structure
The largest groups of foreigners legally registered in Mönchengladbach came from Turkey (7954), Poland (1851), Serbia (1646), Greece (1313), Italy (1239), Netherlands (1091), Portugal (927) on March 31, 2008 ), Ukraine (827), Spain (762), Great Britain (673), Russia (666), Morocco (629), Iraq (549), Sri Lanka (435), Croatia (392), Macedonia (375), Bosnia and Herzegovina (359) and Austria (333). The official statistics do not include naturalized persons and German-born children of foreign origin as foreigners.
| population | As of December 31, 2006 |
|---|---|
| Residents with main residence | 260,951 |
| of which male | 126,282 |
| Female | 134,669 |
| German | 232,953 |
| of which male | 111,750 |
| Female | 121.203 |
| Foreigners | 27,998 |
| of which male | 14,532 |
| Female | 13,466 |
| Proportion of foreigners in percent | 10.7 |
Source: State Office for Data Processing and Statistics North Rhine-Westphalia
age structure
The following overview shows the age structure as of December 31, 2006 (main residences).
| Age from / to | population | Share (in percent) |
|---|---|---|
| 0-5 | 11,398 | 4.4 |
| 6-14 | 26,657 | 10.2 |
| 15-17 | 9,374 | 3.6 |
| 18-24 | 21,343 | 8.2 |
| 25-29 | 14,906 | 5.7 |
| 30-39 | 34,213 | 13.1 |
| 40-49 | 42,711 | 16.4 |
| 50-59 | 34,586 | 13.3 |
| 60-64 | 13,758 | 5.3 |
| over 65 | 52.005 | 19.9 |
| total | 260,951 | 100.0 |
Source: State Office for Data Processing and Statistics North Rhine-Westphalia
| Age structure of the inhabitants of the city of Mönchengladbach | ||||
|---|---|---|---|---|
| Age | Residents | |||
| 0-5 | 10,290 | |||
| 5-10 | 11,054 | |||
| 10-14 | 12,769 | |||
| 15-19 | 14,010 | |||
| 20-24 | 15,837 | |||
| 25-29 | 15,229 | |||
| 29-30 | 14,290 | |||
| 35-39 | 14,222 | |||
| 40-44 | 19,910 | |||
| 45-49 | 22,464 | |||
| 50-54 | 20,107 | |||
| 55-59 | 17,251 | |||
| 60-64 | 15,415 | |||
| 65-69 | 12,837 | |||
| 70-74 | 15,377 | |||
| 75-79 | 10,773 | |||
| 80-84 | 7,484 | |||
| 85-89 | 4.157 | |||
| 90- | 1,712 | |||
| Data source: 2011 census, Information and Technology North Rhine-Westphalia, May 9, 2011 | ||||
Townships
The population figures refer to March 31, 2008 (main residences).
| No. | Borough | population | Male | Female | Foreigners in% |
|---|---|---|---|---|---|
| 01 | Rheindahlen | 27,026 | 13,066 | 13,960 | 6.2 |
| 02 | Hardt | 16,788 | 8,191 | 8,597 | 4.9 |
| 03 | City center | 57,584 | 27,695 | 29,889 | 13.9 |
| 04 | Volksgarten | 23,299 | 11,459 | 11,840 | 14.4 |
| 05 | Neuwerk | 20,932 | 10.158 | 10,774 | 4.9 |
| 06 | Rheydt- West | 24.208 | 11,509 | 12,699 | 10.5 |
| 07 | Rheydt -Mitte | 41,077 | 19,864 | 21,213 | 15.8 |
| 08 | Odenkirchen | 19,956 | 9,696 | 10,260 | 8.4 |
| 09 | Giesenkirchen | 15,791 | 7,588 | 8,203 | 4.0 |
| 10 | Wickrath | 17,905 | 8,656 | 9,249 | 5.4 |
| Mönchengladbach | 264,566 | 127,882 | 136,684 | 10.3 |
Source: City of Mönchengladbach
See also
literature
- Karl Friedrich Wilhelm Dieterici (Ed.): Communications from the Statistical Bureau in Berlin . (1848-1861).
- Imperial Statistical Office (Hrsg.): Statistical yearbook for the German Empire . (1880-1918).
- Statistisches Reichsamt (Ed.): Statistical yearbook for the German Reich . (1919-1941 / 42).
- German Association of Cities (Hrsg.): Statistical yearbook of German municipalities . (1890 ff.).
- Federal Statistical Office (Hrsg.): Statistical yearbook for the Federal Republic of Germany . (1952 ff.).
- Bertelsmann Stiftung (Ed.): Guide to Demographic Change 2020. Analyzes and action plans for cities and municipalities . Bertelsmann Stiftung Publishing House, Gütersloh 2006, ISBN 3-89204-875-4 .
Web links
- Information and technology North Rhine-Westphalia (IT.NRW) . Retrieved February 13, 2009.
- Statistics . City of Mönchengladbach. Retrieved February 13, 2009.
- Guide to the municipality . Bertelsmann Foundation. Retrieved February 13, 2009.
Individual evidence
- ^ Population in the administrative district of Düsseldorf . Information and technology North Rhine-Westphalia (IT.NRW). Archived from the original on March 1, 2009. Info: The archive link was automatically inserted and not yet checked. Please check the original and archive link according to the instructions and then remove this notice. Retrieved February 13, 2009.
- ^ Bertelsmann Foundation: Population forecast
- ↑ Press release Deutsche Post AG: Postbank study "Housing Atlas 2016 - Living in the City": Where population growth causes prices to rise , published on March 3, 2016, accessed on March 3, 2016
- ^ Population of the city of Mönchengladbach at the place of the main residence on 09/30/2008 . City of Mönchengladbach. Archived from the original on March 18, 2007. Info: The archive link was inserted automatically and has not yet been checked. Please check the original and archive link according to the instructions and then remove this notice. Retrieved February 13, 2009.
- ↑ 2011 census: population and households. City of Mönchengladbach, May 9, 2011. ( Memento of the original from April 3, 2015 in the Internet Archive ) Info: The archive link was inserted automatically and has not yet been checked. Please check the original and archive link according to the instructions and then remove this notice. (PDF)
- ↑ The population of the city of Mönchengladbach at the location of the main residence by district and city district on 09/30/2008 . City of Mönchengladbach. Archived from the original on October 21, 2007. Retrieved February 13, 2009.


