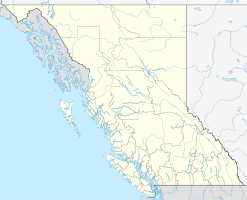
Vancouver Harbor
| Vancouver Harbor | |||
|---|---|---|---|
| Data | |||
| UN / LOCODE | CAVAN | ||
| operator | Vancouver Fraser Port Authority (from 2008) | ||
| opening | 1964, new operator in 2008 | ||
| Port type | seaport | ||
| Total area of the port | Coastline 247 km, land area 4.6 km², water area 60 km² |
||
| Passengers | 842,928 (2017) | ||
| Goods handled | Containers, general cargo, bulk cargo, cars and passengers | ||
| Throughput | 142.08 million tons (2017) | ||
| Container (TEU) | 3.25 million TEU (2017) | ||
| website | http://portmetrovancouver.com | ||
| Geographic information | |||
| place | Vancouver | ||
| province | British Columbia | ||
| Country | Canada | ||
| Port of Vancouver (container terminal on Burrard Inlet) | |||
| Coordinates | 49 ° 17 '7 " N , 123 ° 4' 50" W | ||
|
|||
The harbor Vancouver ( English Port of Vancouver ) is the largest seaport in Canada and the Pacific Northwest , the second largest sea port on the west coast of North America and even the most diversified of the continent. The state-owned Vancouver Fraser Port Authority has been responsible for managing the port area since 2008 .
In 2016, the port created around 96,200 jobs, 44,400 of which were direct, and generated around CAD 9.9 billion in gross domestic product .
geography
The port facilities are spread across Vancouver and various neighboring communities. In Vancouver to find plants on the Fraser River and the south shore of Burrard Inlet . The facilities on the north bank of Burrard Inlet are located in North Vancouver or in the North Vancouver District . The Roberts Bank Superport in Delta and the facilities in Burnaby , Port Moody , Richmond and Surrey are also part of Port Vancouver. However, the area of responsibility of the Vancouver Fraser Port Authority also includes other water and bank areas in the Greater Vancouver Regional District , such as the roadstead in English Bay .
There are 27 transshipment points for five different areas:
- Automobiles ; 1 system (on the Fraser River)
- Breakbulk ; 2 facilities (on the Fraser River and on Burrard Inlet)
- Bulk ; 19 systems (in Burnaby, Delta and Port Moody as well as on Burrard Inlet)
- Container ; 4 systems (in Delta as well as on the Fraser River and on Burrard Inlet)
- Cruise ; 1 cruise terminal at Burrard Inlet ( Canada Place )
history
With the opening of the Panama Canal in 1914, the Port of Vancouver was able to compete seriously with other major ports. Due to its location, the port could offer an alternative shipping route to Europe. At the beginning of 1920, the British Columbia provincial government fought against the freight rate , which discriminated against shipping through additional taxes and duties as opposed to train freight . With the abolition of the freight rate and the establishment of a supervisory authority, the Harbor Commission (1923), which was the predecessor of the Port Authority , freight traffic became increasingly important. In 1930, the amount of commercial cargo traffic increased, making it the largest addition to Vancouver's economy.
On January 1, 2008, the North Fraser Port Authority and Fraser River Port Authority merged to form the new Vancouver Fraser Port Authority.
Statistics and utilization
In 2017, 142.08 million tons of freight were handled. An increase of 5% compared to the year 2016 with 135.58 million tons. 3219 ships with 155.2 million register tons ( metric GRT ) called at the port.
In 2017, 3.25 million TEU with around 26 million tons were handled. A total of 115.62 million tons of bulk and general cargo as well as 429,875 cars were loaded. The countries with the strongest handling, with around half of the total handling volume from which cargo comes or goes into cargo, are China, Japan and South Korea. From May to September Vancouver is the starting point for numerous cruise ships ; 842,928 passengers traveled from the jetties at Canada Place in 2017, mainly in the direction of Alaska .
expansion
Studies assume that container freight traffic on the west coast of North America will triple in twenty years. As a result of this development, the port operator company announced that it would be expanding its container capacities.
Web links
Individual evidence
- ↑ a b c d Statistics Overview 2017. Port of Vancouver, accessed on July 17, 2017 (English).
- ^ Port of Vancouver - 2016 Economic Impact Study. InterVISTAS, May 25, 2017, accessed on July 17, 2018 .
- ^ Terminals and Facilities. Port of Vancouver, accessed July 17, 2018 .

