Cooperativity
Cooperativity , a term from biochemistry, characterizes the function of transport proteins (including receptors ) and of enzymes , which consist of several subunits (so-called " oligomeric proteins").
definition
Proteins from several similar subunits often show the phenomenon of cooperativity: the binding strength of a ligand depends on how many of the remaining subunits already carry a ligand. As the bond becomes increasingly stronger, the well-studied phenomenon of positive cooperativity emerges . If the ligands interfere with each other, so that the last binding sites with low affinity are taken up, the less known (but just as common) phenomenon of negative cooperativity follows . The first case acts like a switch (proteins with ligands at all binding sites and proteins without any ligands dominate the scene, partially saturated proteins are underrepresented). In the second case, the degree of binding of the proteins is more uniform and depends on the ligand concentration.
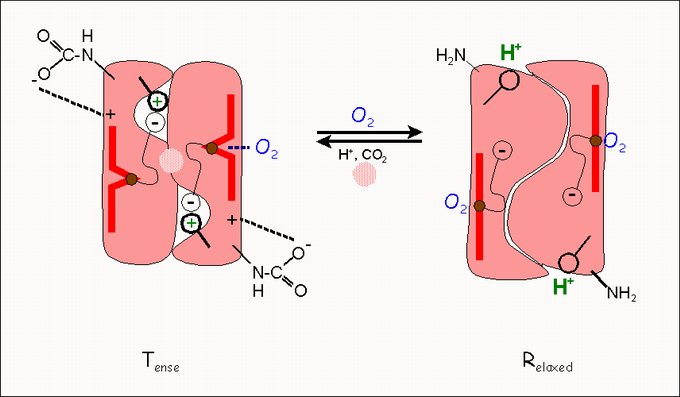
The prototype of an allosteric protein with positive cooperativity is the ( tetrameric ) hemoglobin consisting of four subunits . In contrast to the monomeric oxygen carrier protein myoglobin , hemoglobin binds not only oxygen (O 2 ) but also protons (H + ), carbon dioxide (CO 2 ) and chloride ions . The binding properties of oxygen to the tetramer (which is shown for simplicity as a dimer in the figure) are modulated in many ways:
- The binding of O 2 favors the binding of further O 2 molecules to the same hemoglobin molecule;
- the binding strength of the O 2 is pH-dependent. In addition to an increasing hydrogen ion concentration , an increasing CO 2 concentration also promotes the release of O 2 . It is precisely these signals that the muscle uses to signal its need for oxygen,
- Finally, the release of oxygen is promoted by a special regulator molecule - in humans this is 2,3-bisphosphoglycerate (2,3-BPG; circle on the T-state ). The regulation of the oxygen supply via 2,3-BPG is of outstanding importance for the supply of a fetus and for the supply of humans under the conditions of great heights (mountain climbers!)
All of the ligands mentioned (except for O 2 itself) force the release of oxygen, that is, the transition from the high-affinity R conformation to the low-affinity T conformation. The following figure shows the principle of this regulation: the conformational transition from T (tense) to R (relaxed) is triggered by the fact that the oxygen pulls the central iron atom (Fe ++ , brown circle) in the heme (red bar) into the plane. Other protein groups, amino acid residues, follow this movement, breaking hydrogen bonds and releasing the so-called “ Bohr protons ” (H + ) and CO 2 .
Evidence and description
Cooperatively binding proteins (carriers, receptors, enzymes) do not follow the principle of the saturation hyperbola : they either show a "sigmoid" (positive cooperativity) or a "pseudohyperbolic" binding behavior (negative cooperativity). The negative cooperativity was and is often overlooked only because of the inconspicuous, hyperbola-like characteristics.
The binding curves
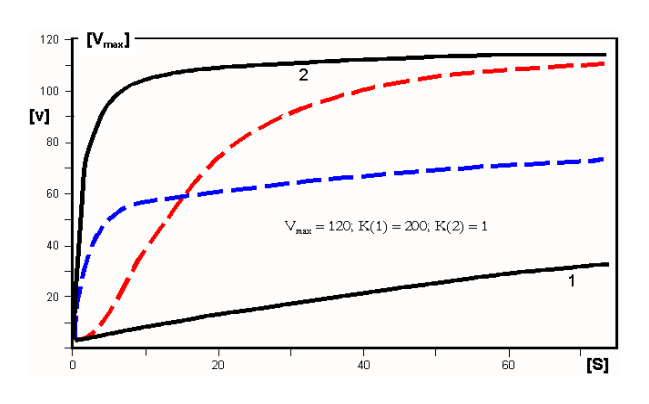
According to Adair, the phenomenon of cooperativity can be described by functions that have two Km values, K (1) and K (2). These complex functions can in turn be understood as a transition between two saturation hyperbolas (1 and 2, i.e. black curves in the following figure):
- Positive cooperativity : in the ground state (T), binding initially occurs according to hyperbola 1 (low affinity). Then the transition to the high-affinity state (R) occurs, so that further ligands bind according to hyperbola 2. The transition between these states corresponds to the red line, which has a distinctly sigmoid shape and is easy to diagnose. The curve shown corresponds to a Hill coefficient of 1.92;
- Negative cooperativity : to be understood as the reverse transition between a state of high affinity (small Km value; hyperbola 2) to such a low affinity (high Km value; hyperbola 1). The transition between these states corresponds to the blue line, which seems to resemble a hyperbola, but is different from it: it is characterized by a Hill coefficient n H = 0.63.
Negative cooperativity was first discovered for the binding of NAD + by glyceraldehyde-3-phosphate dehydrogenase (GAPDH).
- Half -of-the-sites reactivity: extreme form of negative cooperativity, in which an oligomeric enzyme with 2n binding sitesreacts(almost) exclusivelywith the substrateat n binding site (s).
Linearizations
Clear indications of cooperativity can be found if the binding curves are subjected to the "linearization process" described under " Enzyme kinetics ": characteristic deviations from a straight line result here - particularly noticeable in the case of the Scatchard diagram . These deviations are most likely leveled in the Hill diagram , which, however, would have end branches of 45 ° (slope = 1) if there were enough measuring points in the upper and lower range of the substrate concentrations. Only in the case of n H = n (maximum cooperativity) would these be omitted:
- the Hill coefficient, n H , describes the degree of cooperativity and cannot exceed the number of interacting subunits (n). For hemoglobin (n = 4), n H = 2.9, derived from the slope at the zero crossing.
- for negative cooperativity n H <1
The best determination of the cooperativity parameters takes place today on the way of "non-linear regression" using
- the Hill equation , d. H. an extended Michaelis-Menten equation : parameters n H and K 50 (substrate concentration at which 50% saturation is reached);
- the Adair equation : parameters K T and K R (dissociation constants for the "T" and the "R state"). The examples of the saturation functions below were used for the values
- K T = 15, K R = 1 calculated:
See also: glucokinase
Hill coefficient
With the Hill equation, the cooperativity of the bond can be described quantitatively. The proportion of saturation of the ligand binding sites is shown as a function of the ligand concentration. The Hill coefficient is a measure of the steepness of the curve.
with EC90 and EC10 for the measured values at 10% and 90% of maximum saturation, respectively.
Response coefficient
With sigmoid curves, the Hill coefficient is too imprecise, which is why the response coefficient is used:
The relationship between the Hill coefficient and the response coefficient is as follows:
with as mean value of the variable X in the range [ a , b ].
Web links
- Michael L. Berger: 9 inhibitors, IC 50 & K i , Hill coefficient. In: Analysis of neurotransmitter receptors using radioligands. University of Vienna, March 2007, accessed on May 8, 2020 .
Individual evidence
- ↑ Description and literature overview
- ↑ Kholodenko, Boris N., et al .: Ultrasensitivity in signaling cascades revisited: Linking local and global ultrasensitivity estimations. . In: FEBS Letters . 414, No. 2, 1997.
- ↑ E. Altszyler, AC Ventura, A. Colman-Lerner, A. Chernomorets: Ultrasensitivity in signaling cascades revisited: Linking local and global ultrasensitivity estimations. . In: PLoS ONE . 12, No. 6, 2017.


